

What you'll learn
- How to choose the right type of map for different geographical data.
- How to use OS map skills: grid references, scale, distance, contours and spot heights.
- How to interpret cross-sections, transects and thematic maps.
- How GIS layers help you analyse spatial patterns and evaluate evidence.
What are cartographic skills?
Cartographic skills
Cartographic skills are the skills used to select, construct, adapt and interpret maps so that geographical information is shown accurately and clearly.
A map is a simplified representation of part of the Earth’s surface. Maps can work at many scales: a global atlas map showing population distribution, a national map of UK rainfall, a regional map of transport links, or a local OS map for fieldwork.
A strong map normally includes:
- a title explaining what the map shows
- a scale showing the relationship between map distance and real distance
- a key or legend explaining symbols and colours
- a north arrow or clear orientation
- grid lines or coordinates to locate places
- annotations: short labels that explain important features
- a source and date, especially for data maps
Maps are evidence
In GCSE Geography, maps are not just pictures. You use them as evidence: to locate features, measure distances, identify patterns, explain relationships and judge how reliable the information is.
Choosing the right type of map
Different maps are useful for different jobs. A good geographer chooses the map type that matches the question and the data.
| Map type | What it is useful for | Example use |
|---|---|---|
| Atlas map | Showing broad patterns at global, continental or national scale | World climate zones, UK major cities |
| OS map | Detailed local information using symbols, grid references and contours | Planning a route in the Lake District |
| Base map | A simple outline map you add data to | Drawing fieldwork results onto a school catchment map |
| Thematic map | Any map focused on one theme | Population density, earthquake risk, land use |
| Choropleth map | Areas shaded according to a value | % of people over 65 by local authority |
| Isoline map | Lines join points of equal value | Contours for height, isobars for pressure |
| Flow line map | Arrows show movement; width often shows volume | Migration flows between countries |
| Desire-line map | Straight lines show links between origins and destinations, not actual routes | Commuting links into London |
| Sphere of influence map | Shows the area served by a place or service | Catchment area of a shopping centre |
| Route map | Shows a journey or pathway | Fieldwork walk through a coastal town |
| Sketch map | Simplified map highlighting key features | Annotated sketch of a river meander |
Choropleth map
A choropleth map uses different shades or colours for areas, such as counties or countries, to show how a value varies from place to place.
Isoline map
An isoline map uses lines to join points with the same value. Contours join equal height; isobars join equal air pressure; isotherms join equal temperature.
Using raw totals on choropleth maps
Choropleth maps usually work best with rates, percentages or densities, not raw totals. A large area may have a big total just because it is large, not because the pattern is genuinely intense there.
Choosing a map for rainfall data
A geography class wants to show how average annual rainfall varies across the UK.
- The data changes gradually across space, so a map that shows a continuous surface is more useful than dots or symbols.
- Rainfall can be shown using lines joining places with equal rainfall, for example 800 mm or 1,000 mm, so an isoline map would work well.
- If the data is only available by region, a choropleth map could be used instead, but it would hide detail within each region.
Constructing and adapting maps
To construct a map means to make one from data. To adapt a map means to change it for a purpose, such as adding annotations, simplifying detail, changing scale, or adding data onto a base map.
When constructing a map, think about:
- purpose: what question should the map answer?
- scale: global, national, regional or local?
- classification: how will values be grouped?
- symbols: are they clear and consistent?
- annotations: do labels explain the pattern, not just name places?
- data source: is it reliable and up to date?
Map annotation
A good annotation does more than label. Instead of “river”, write “river valley creates a transport corridor through the steep relief”.
OS maps: coordinates and grid references
OS maps are Ordnance Survey maps used in the UK. GCSE questions often use two scales:
- 1:25 000: more detailed; 1 cm on the map represents 250 m in real life
- 1:50 000: covers a larger area; 1 cm on the map represents 500 m in real life
Grid reference
A grid reference locates a place using numbered grid lines. Eastings are vertical grid lines read from west to east. Northings are horizontal grid lines read from south to north.
You always read grid references along the corridor, then up the stairs: easting first, northing second.
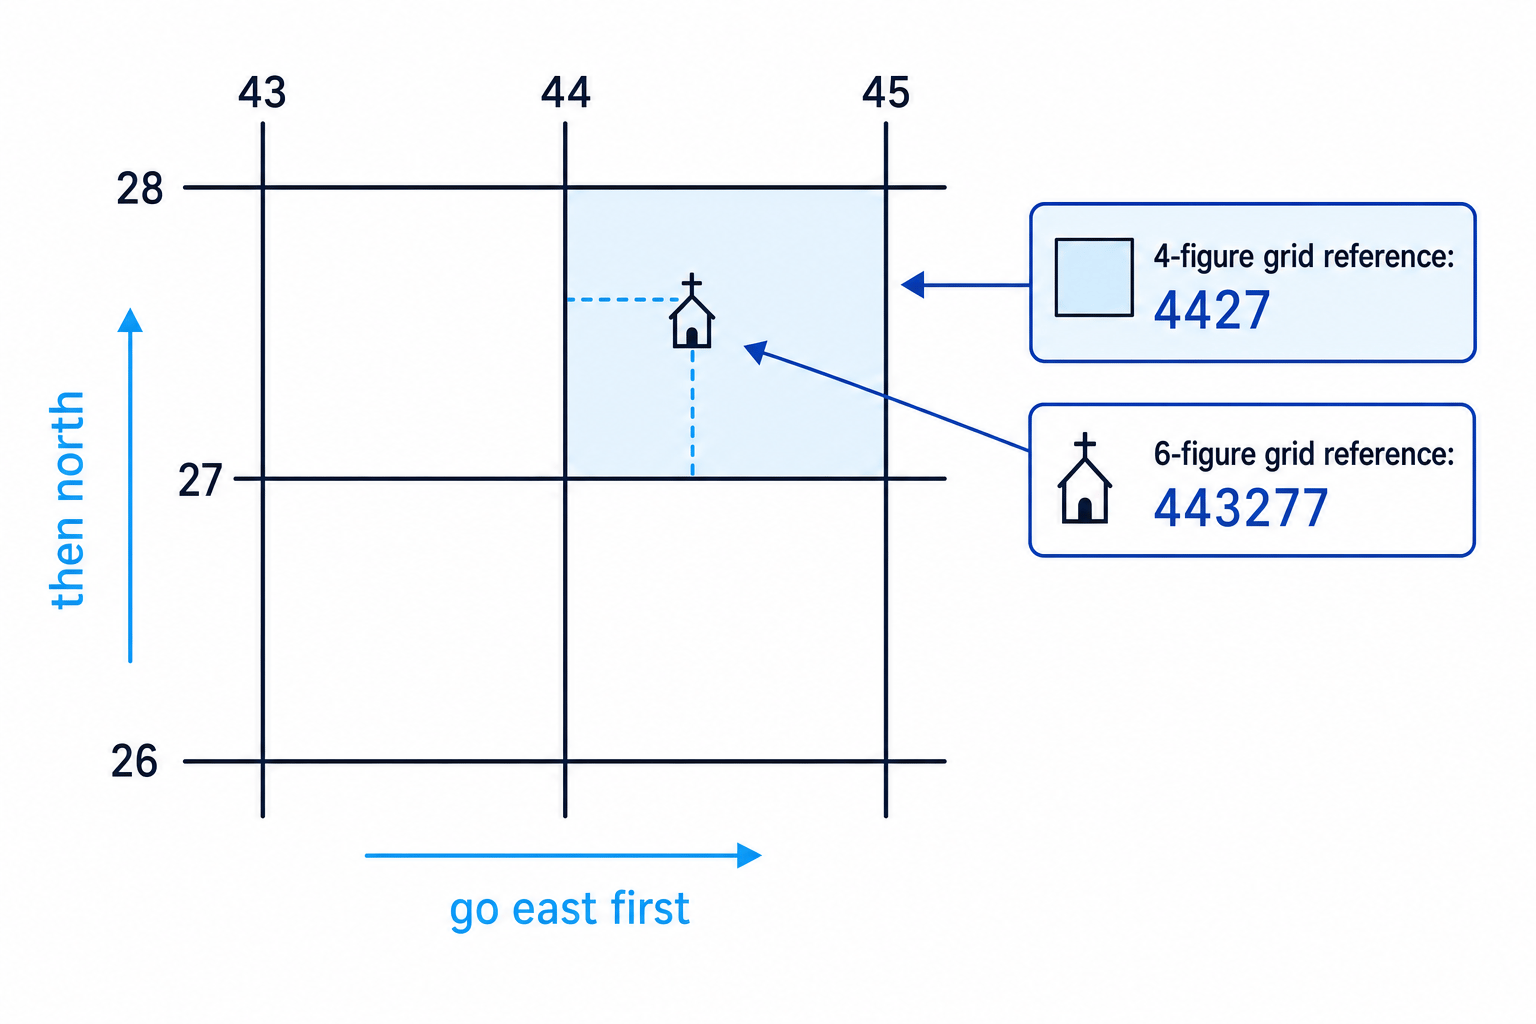
A four-figure grid reference identifies a whole grid square. A six-figure grid reference identifies a more precise point inside that square by splitting it into tenths.
Finding a six-figure grid reference
A church is in grid square 4427. It is about three tenths across the square from easting 44 and seven tenths up from northing 27.
- Start with the easting on the left of the square: 44. Add the tenths across: 3. The easting becomes 443.
- Start with the northing at the bottom of the square: 27. Add the tenths up: 7. The northing becomes 277.
- Put easting first and northing second, so the six-figure grid reference is 443277.
Scale and distance
Scale
Scale is the relationship between distance on a map and distance in the real world. A scale of 1:50 000 means 1 unit on the map equals 50,000 of the same units in real life.
A straight-line distance is measured directly between two points. A route distance follows the actual path, such as a road, river or walking route, so it is usually longer.
For curved routes, use a piece of string or the edge of paper, mark the route carefully, then compare it with the scale bar.
Calculating real distance from map scale
A footpath measures 7.2 cm on a 1:50 000 OS map.
- Use the scale ratio to convert map distance to real distance:
- Substitute the values:
- Convert centimetres to kilometres. There are 100,000 cm in 1 km, so 360,000 cm is 3.6 km.
Bigger scale does not mean bigger area
A 1:25 000 map is a larger-scale map than a 1:50 000 map because it shows more detail. However, it covers a smaller real-world area on the same size paper.
Relief, contours and spot heights
Relief
Relief means the height and shape of the land, including hills, valleys, slopes and lowland areas.
Contour
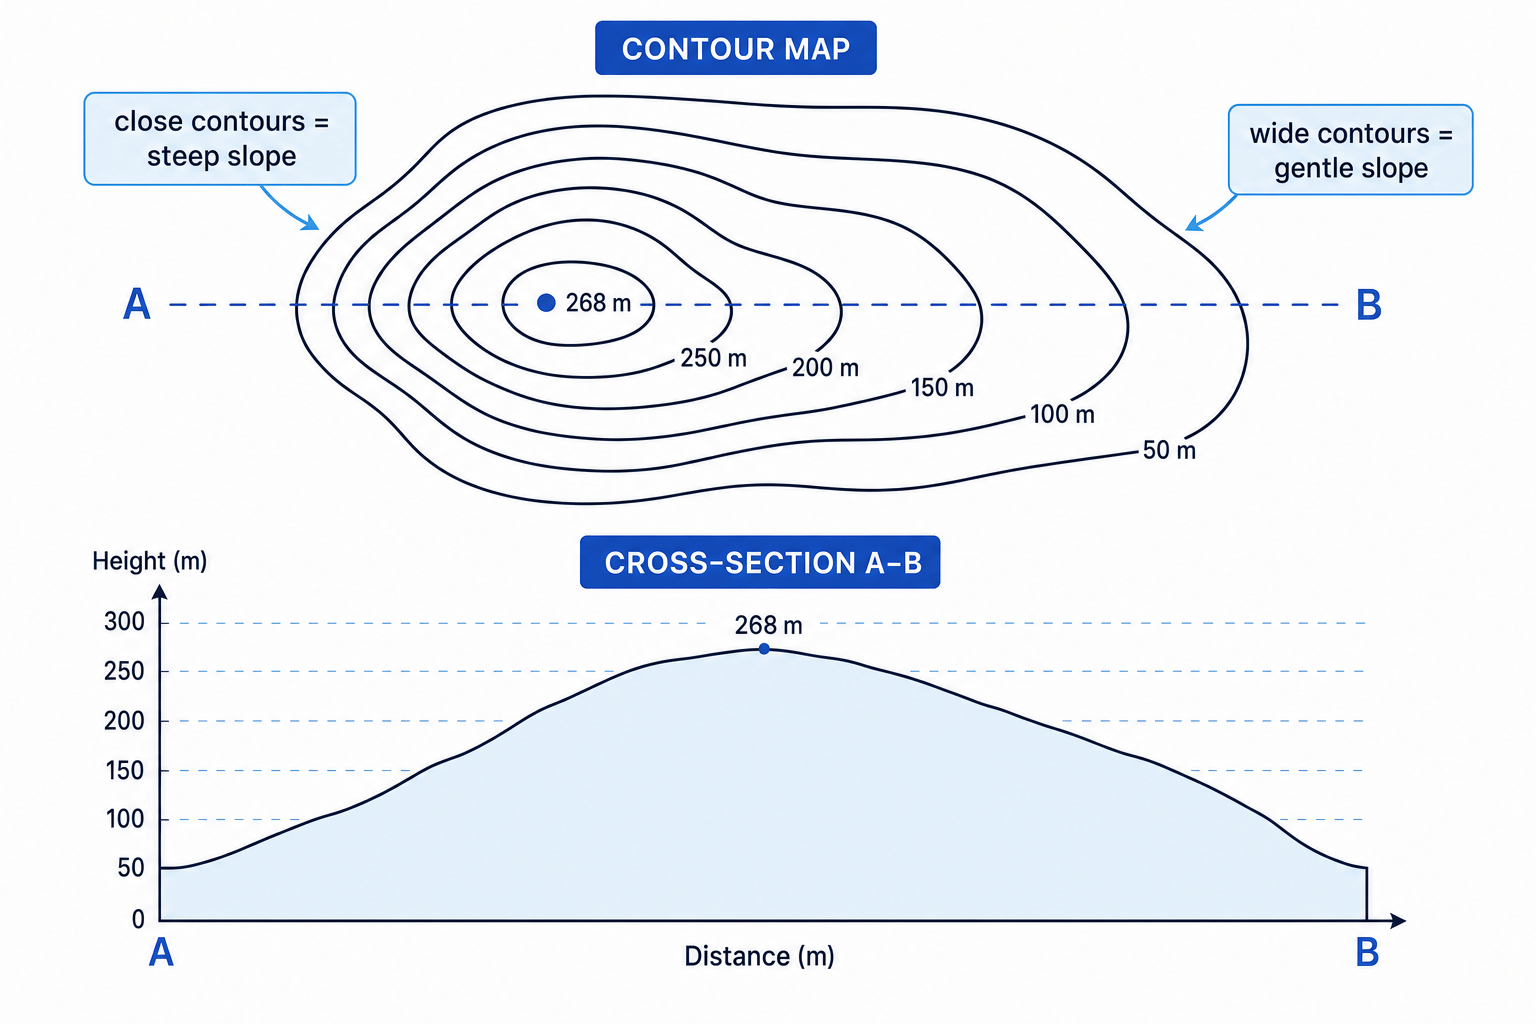
A contour is a line on a map joining points of equal height above sea level. The gap in height between contour lines is the contour interval.
Spot height
A spot height is a point on a map labelled with its exact height above sea level, often shown at a summit, road junction or trig point.
Contours help you understand slopes:
- close contours = steep slope
- wide contours = gentle slope
- concentric closed contours = hill or summit
- contours crossing a valley often form a V-shape pointing upstream
Gradient
Gradient
Gradient means the steepness of a slope. It compares the vertical change in height with the horizontal distance travelled.
The basic formula is:
gradient=vertical intervalhorizontal distance \text{gradient} = \frac{\text{vertical interval}}{\text{horizontal distance}} gradient=horizontal distancevertical intervalMake sure both distances are in the same units before calculating.
Calculating gradient
A path rises from 50 m to 250 m over a horizontal distance of 1 km.
- Calculate the vertical interval: 250 m minus 50 m gives 200 m.
- Convert the horizontal distance into metres: 1 km is 1,000 m.
- Divide height gain by horizontal distance:
- As a percentage, the gradient is 20%. As a ratio, it is about 1:5, meaning 1 m up for every 5 m across.
Cross-sections and transects
Cross-section
A cross-section is a side-on view of the landscape along a line, showing how height changes with distance.
Transect
A transect is a line across a landscape or study area along which data is collected or interpreted. Transects are common in fieldwork, such as recording land use from a city centre to the suburbs.
To interpret a cross-section, look for:
- the highest and lowest points
- steep and gentle sections
- valleys, ridges and summits
- how physical features might affect human activity, such as routes, settlement or farming
Interpreting a hill cross-section
A cross-section from A to B rises from 50 m to a summit of 268 m, then falls back towards lower land.
- Compare the height at each end with the summit. The land climbs from A to the summit, then descends towards B.
- Link steepness to contour spacing. If the contours are closer on the A side, that slope is steeper than the B side.
- Add geographical interpretation. A steep side may limit road building or farming, while a gentler side may be easier for paths, settlement or grazing.
Extracting, interpreting, analysing and evaluating map information
These words often appear in GCSE questions, and they ask you to do different things.
- Extract: read information directly from the map, such as a grid reference, height or named place.
- Interpret: say what the information means, such as “settlements are clustered along the valley floor”.
- Analyse: break the pattern down, compare areas, use evidence and suggest relationships.
- Evaluate: judge strengths and limitations, such as scale, date, accuracy or missing data.
A strong map paragraph
Use pattern + evidence + anomaly + possible reason. For example: “Population density is highest in the south-east, especially around London. A lower-density anomaly appears in upland areas such as the Scottish Highlands, possibly because relief and remoteness limit settlement.”
For thematic maps, always check:
- what the colours, line widths or symbols mean
- whether the data is total, percentage, density or rate
- the date of the data
- the scale of the map
- whether boundaries hide variation within areas
GIS: maps with layers
GIS
GIS stands for Geographical Information System. It is a digital system for storing, displaying and analysing geo-spatial data in layers.
Geo-spatial data is information linked to location. In GIS, each layer might show something different: rivers, roads, land use, population density, flood risk, building locations or satellite imagery.
GIS is powerful because layers can be combined. For example, a local council could overlay flood-risk zones, housing estates, roads and deprivation data to identify which communities may need extra flood protection.
Analysing flood risk using GIS layers
A GIS map shows a town beside the River Severn with layers for elevation, river distance, housing and roads.
- Identify the physical risk layer first. Low-lying land close to the river is more likely to flood.
- Overlay human features. Housing estates, schools or care homes in the flood-risk zone increase potential impacts.
- Evaluate access and response. If main roads also cross the flood-risk zone, evacuation and emergency access may be more difficult.
- Judge the evidence. The GIS analysis is stronger if the layers are recent, accurate and at a detailed local scale.
GIS is only as good as its data
GIS can make patterns look very convincing, but old, incomplete or low-resolution data can lead to weak conclusions.
In the exam
- Read the map title, key, scale and date before answering; they tell you what the evidence actually shows.
- Use precise map evidence: grid references, distances, heights, compass directions and named places where possible.
- For “analyse” questions, go beyond description by comparing areas, identifying anomalies and suggesting reasons.
- For “evaluate” questions, comment on reliability: scale, data date, classification, missing data or whether a map hides local variation.
Check yourself
- How is a six-figure grid reference more precise than a four-figure grid reference?
- Why might a choropleth map be misleading if it uses raw totals?
- How can contour spacing help you describe and explain the steepness of a slope?
