Skip to content
MathsGenie logo
Open app

Course home

  1. GCSE
  2. Geography Edexcel A
  3. Question bank

Tropical cyclones

EasyMediumHard
1234567891011121314151617181920212223242526272829303132333435363738
Question 29

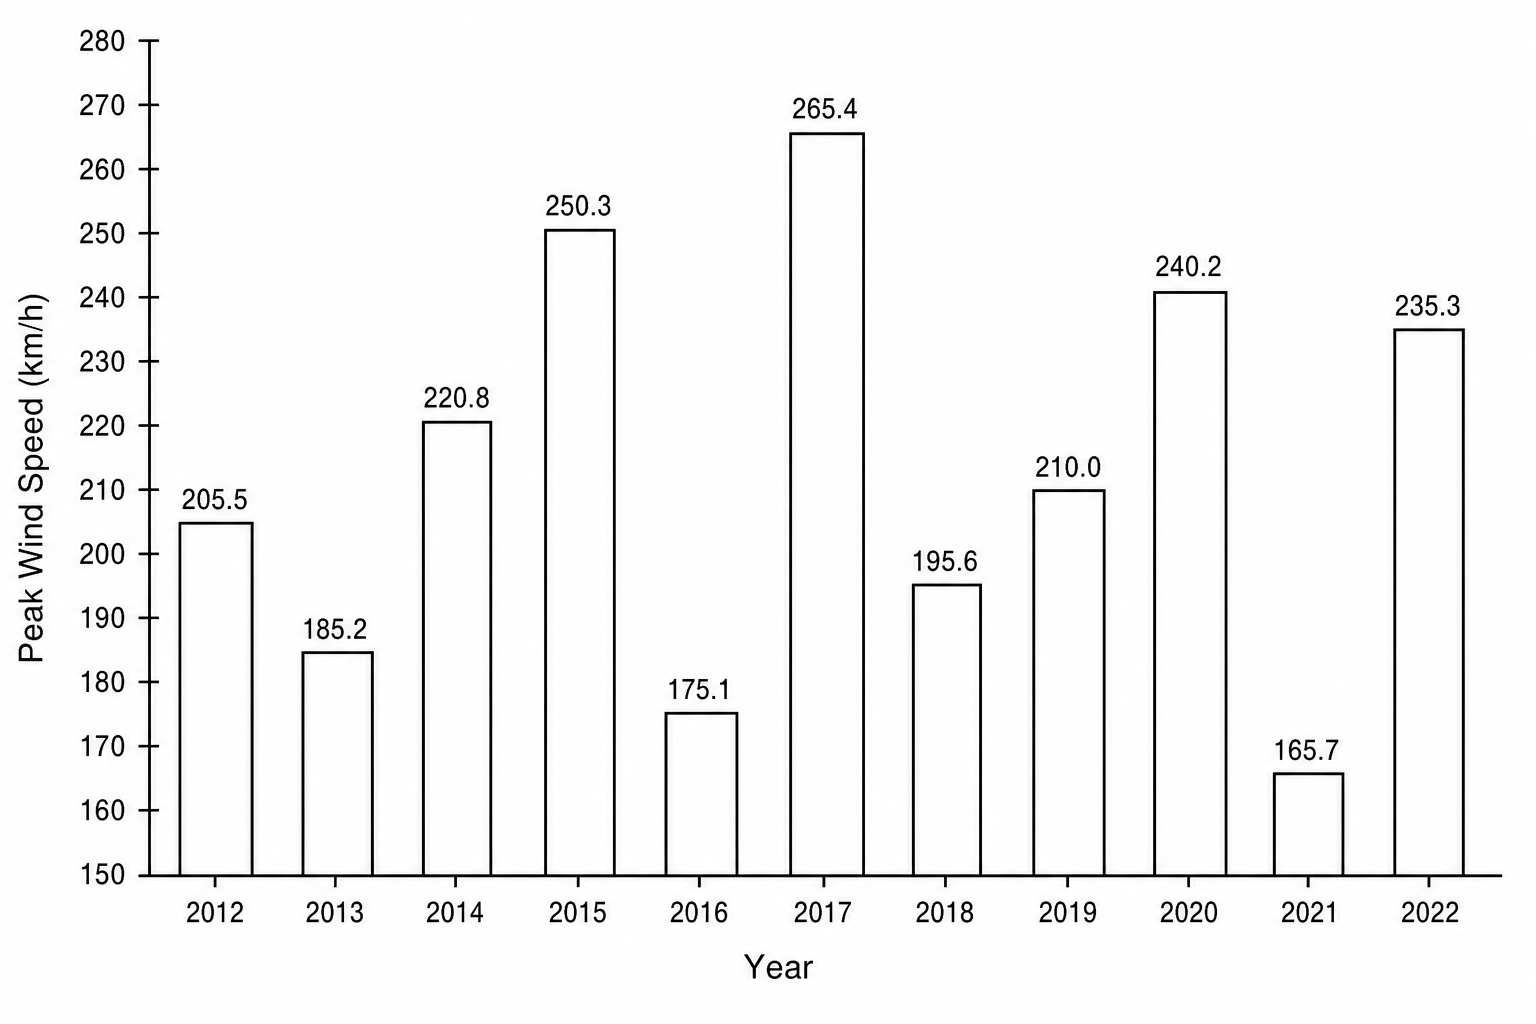
Figure 5

Bar chart showing the peak 10-minute sustained wind speed (in km/h) of the strongest tropical cyclone in the Australian region from 2012 to 2022.

Using Figure 5, calculate the range of peak annual tropical cyclone wind speeds in the Australian region between 2012 and 2022.

Answer to one decimal place.

You must show your working.

[2]

Tropical cyclones Questions

  1. GCSE
  2. /Geography
  3. /Tropical cyclones