Figure 6b is a map showing the track of Cyclone Harold across the South Pacific between 2 and 8 April 2020.
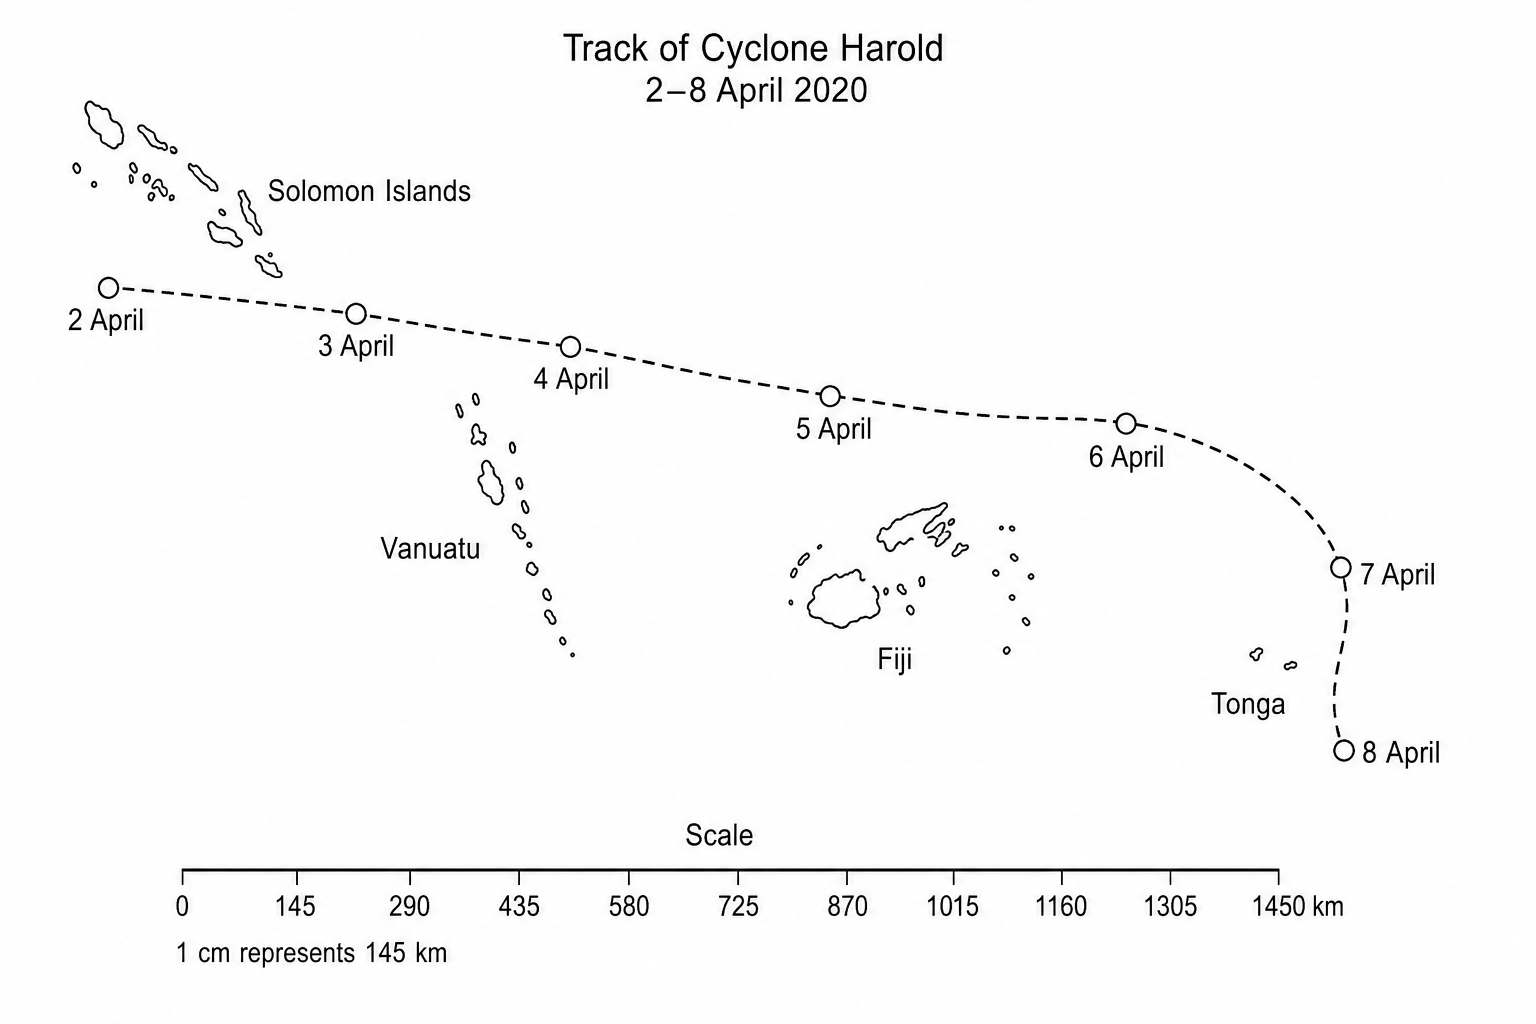
Calculate the total distance travelled by Cyclone Harold between 2 and 8 April 2020.
Answer to one decimal place.
You must show your working in the space below.