The diagram shows a food web from a coastal marine ecosystem.
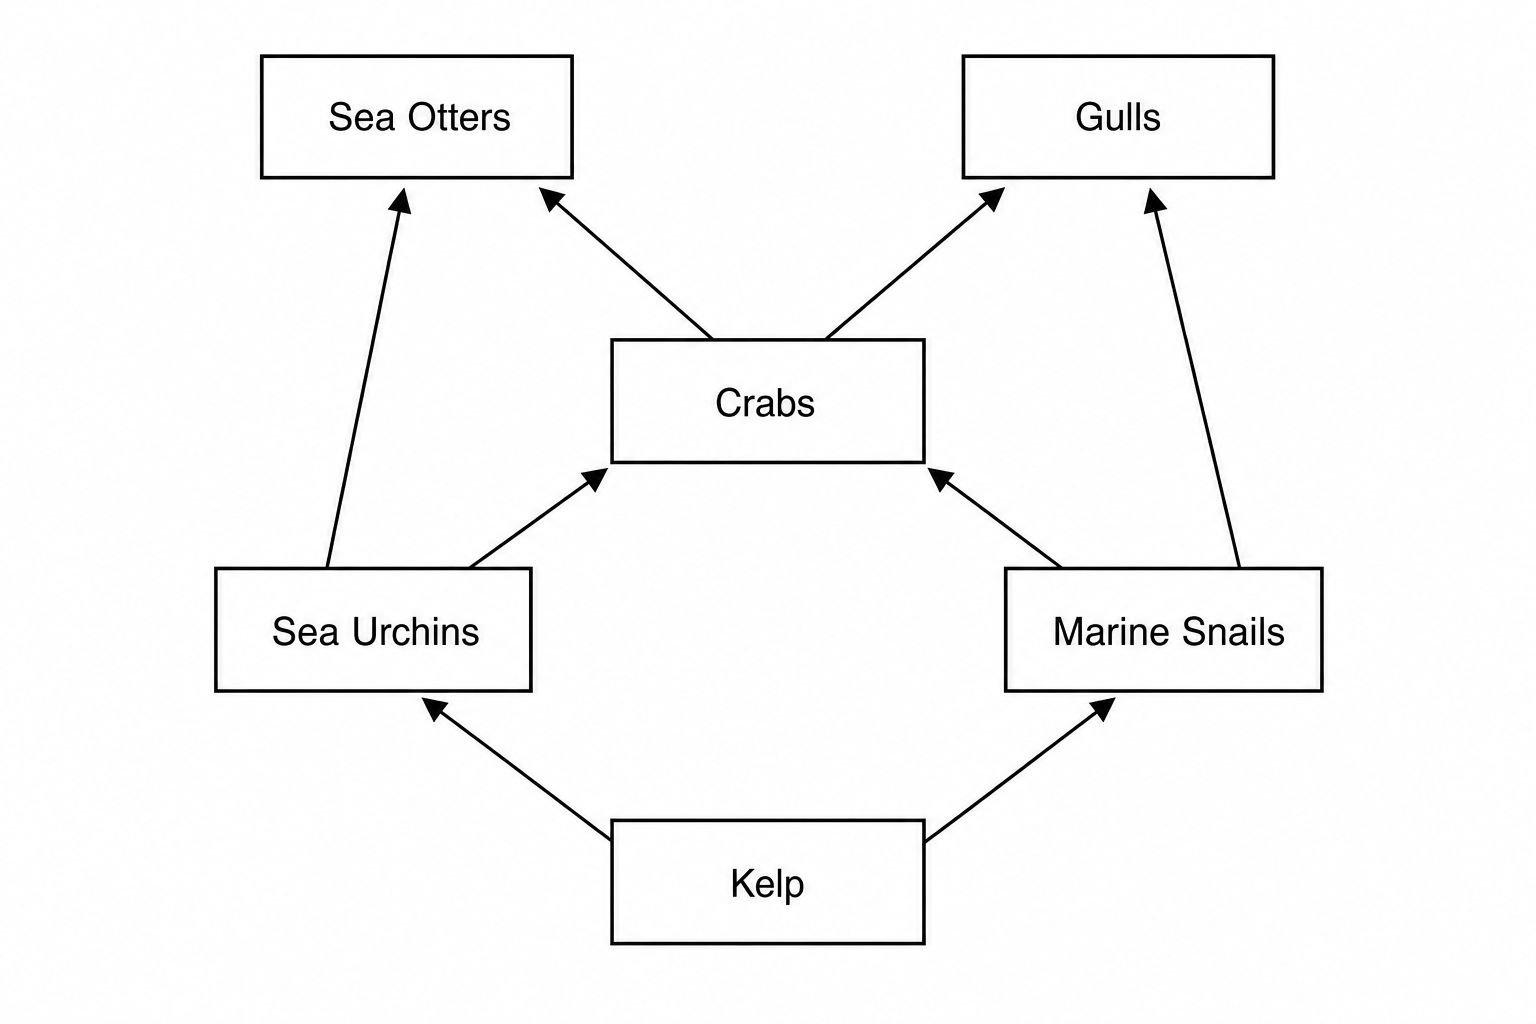
How many species shown in this food web can act as secondary consumers?
A survey was set up to see if the populations of Sea Otters and Gulls changed in a coastal reserve. The numbers of animals were estimated each year from 2011 to 2020. The graph shows the results.
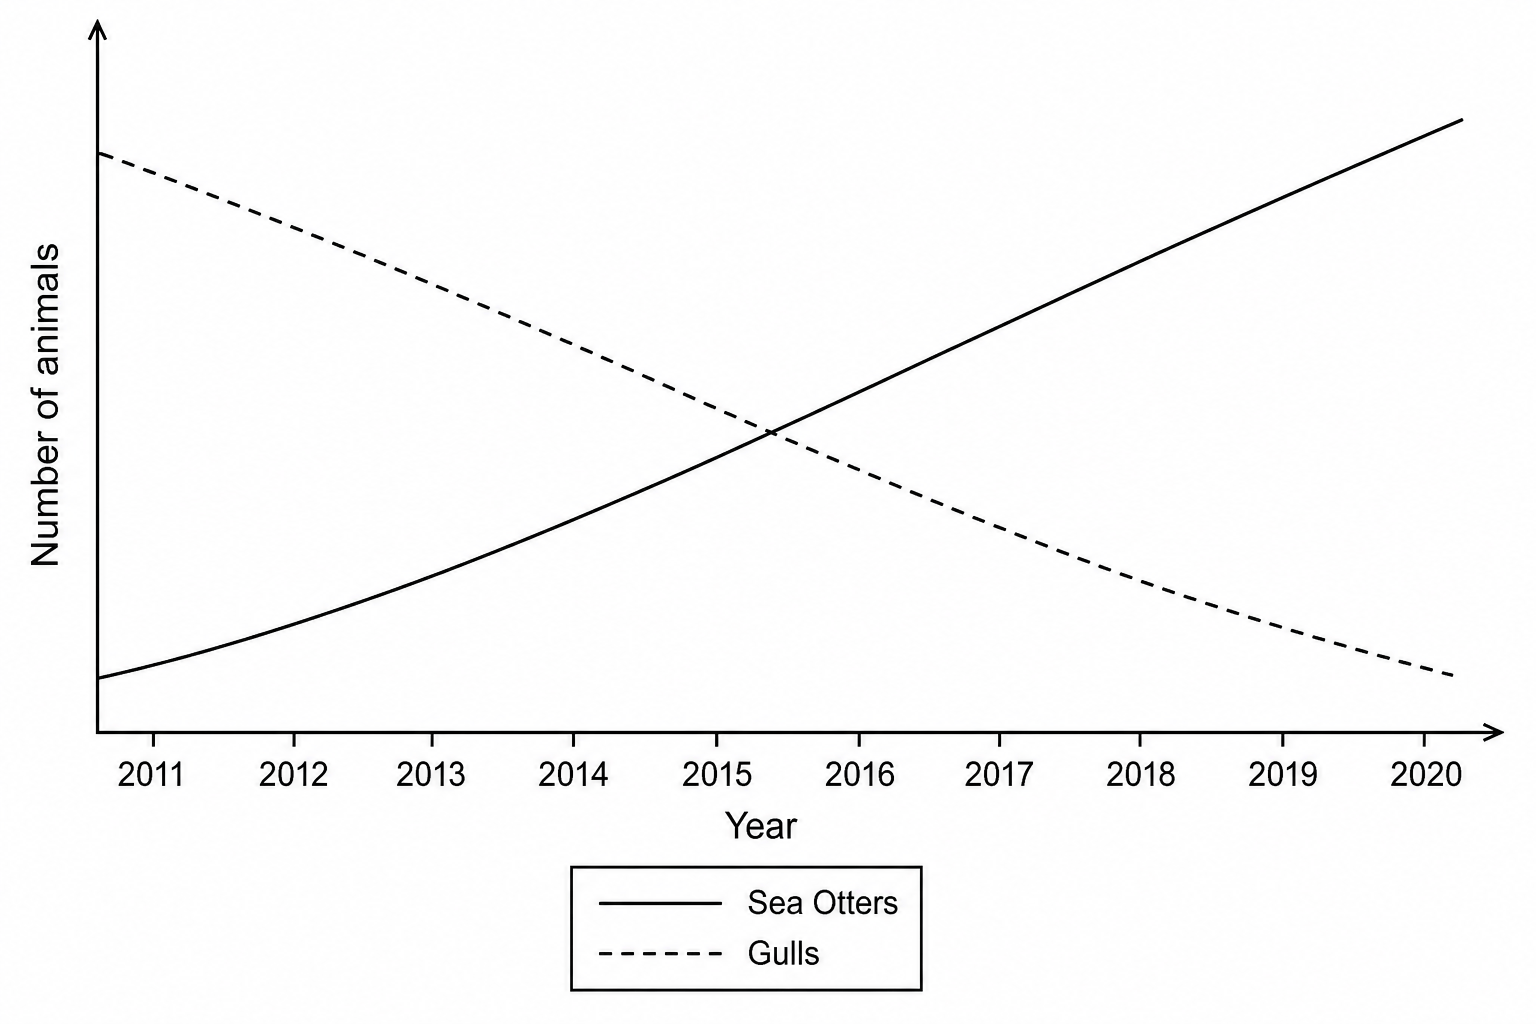
Use the food web to suggest an explanation for the decline in the number of Gulls shown in the graph.
Box turtles are covered by a hard, bony shell. When frightened, they often withdraw their head and limbs completely inside their shell and remain still.
In woodlands, where raccoons and foxes live, this is an advantage to the box turtles. On busy highways, this is a disadvantage. Explain these two conclusions.
Scientists have noticed that box turtles near busy roads are changing their behavior. These turtles do not withdraw into their shells when startled; instead, they crawl away quickly. Scientists believe that genes control this behavior. Explain how this new behavior may become more common in turtle populations near busy roads. Use ideas about natural selection.