The diagram shows the simplified energy flow through a population of sheep grazing in an upland pasture.
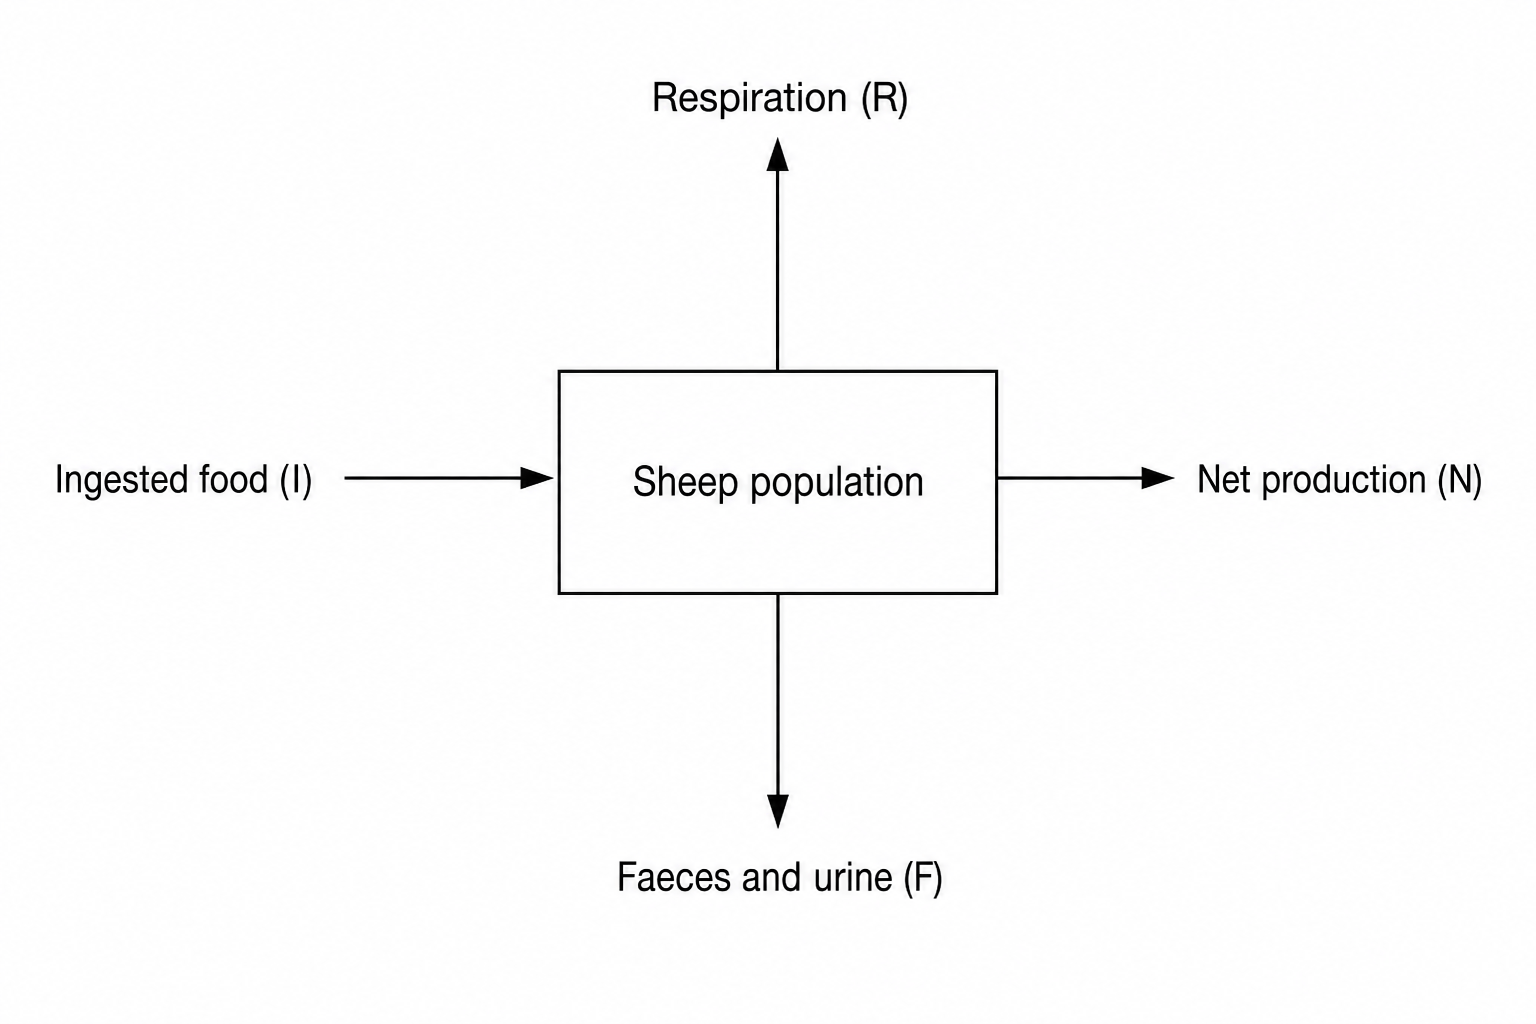
During a one-year study, the following energy values were recorded:
- Energy ingested in food (III): 2.50×10⁵ kJ m−2 yr−12.50 \times 10^5 \text{ kJ m}^{-2}\text{ yr}^{-1}2.50×10⁵ kJ m−2 yr−1
- Energy lost in faeces and urine (FFF): 1.45×10⁵ kJ m−2 yr−11.45 \times 10^5 \text{ kJ m}^{-2}\text{ yr}^{-1}1.45×10⁵ kJ m−2 yr−1
- Energy lost as heat from respiration (RRR): 8.50×10⁴ kJ m−2 yr−18.50 \times 10^4 \text{ kJ m}^{-2}\text{ yr}^{-1}8.50×10⁴ kJ m−2 yr−1
What is the net production (NNN) of this sheep population as a percentage of the ingested energy (III), and which biological processes are directly responsible for the energy lost in faeces and urine respectively?
8.0%8.0\%8.0%; egestion and excretion
8.0%8.0\%8.0%; egestion and respiration
42.0%42.0\%42.0%; egestion and excretion
42.0%42.0\%42.0%; excretion and respiration