In an ecosystem, the energy flow through a population of caterpillars (primary consumers) was monitored over a growing season, as shown in the simplified energy flow diagram below.
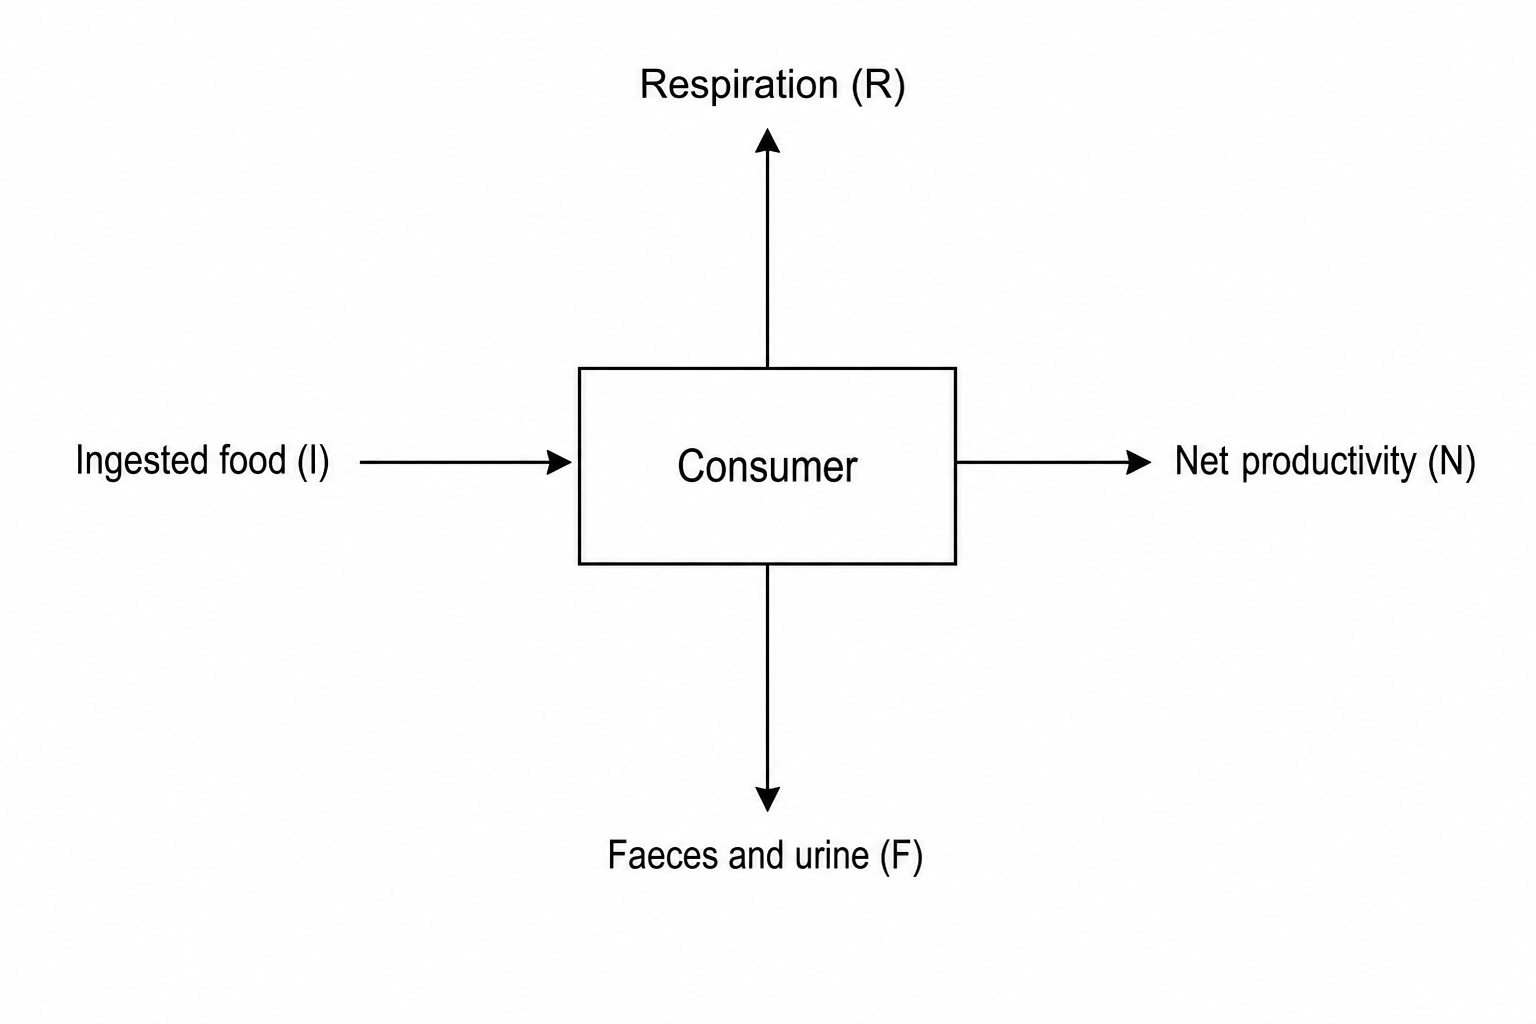
The following ecological data were recorded:
- Total solar energy incident on the habitat: 4.50 × 10⁶ kJ m-2
- Chemical energy of ingested food (III): 2.40 × 10⁴ kJ m-2
- Energy lost in faeces and urine (FFF): 1.32 × 10⁴ kJ m-2
- Energy lost through respiration (RRR): 8.40 × 10³ kJ m-2
Which of the following options correctly identifies the net productivity (NNN) of this caterpillar population and its percentage efficiency of energy transfer from the ingested food?
N=1.08×10⁴ kJ m−2N = 1.08 \times 10^4\text{ kJ m}^{-2}N=1.08×10⁴ kJ m−2, Efficiency=45.0%\text{Efficiency} = 45.0\%Efficiency=45.0%
N=2.40×10³ kJ m−2N = 2.40 \times 10^3\text{ kJ m}^{-2}N=2.40×10³ kJ m−2, Efficiency=22.2%\text{Efficiency} = 22.2\%Efficiency=22.2%
N=2.40×10³ kJ m−2N = 2.40 \times 10^3\text{ kJ m}^{-2}N=2.40×10³ kJ m−2, Efficiency=10.0%\text{Efficiency} = 10.0\%Efficiency=10.0%
N=1.92×10⁴ kJ m−2N = 1.92 \times 10^4\text{ kJ m}^{-2}N=1.92×10⁴ kJ m−2, Efficiency=80.0%\text{Efficiency} = 80.0\%Efficiency=80.0%