Question 2
FDrinking large amounts of alcohol increases the risk of liver cirrhosis.
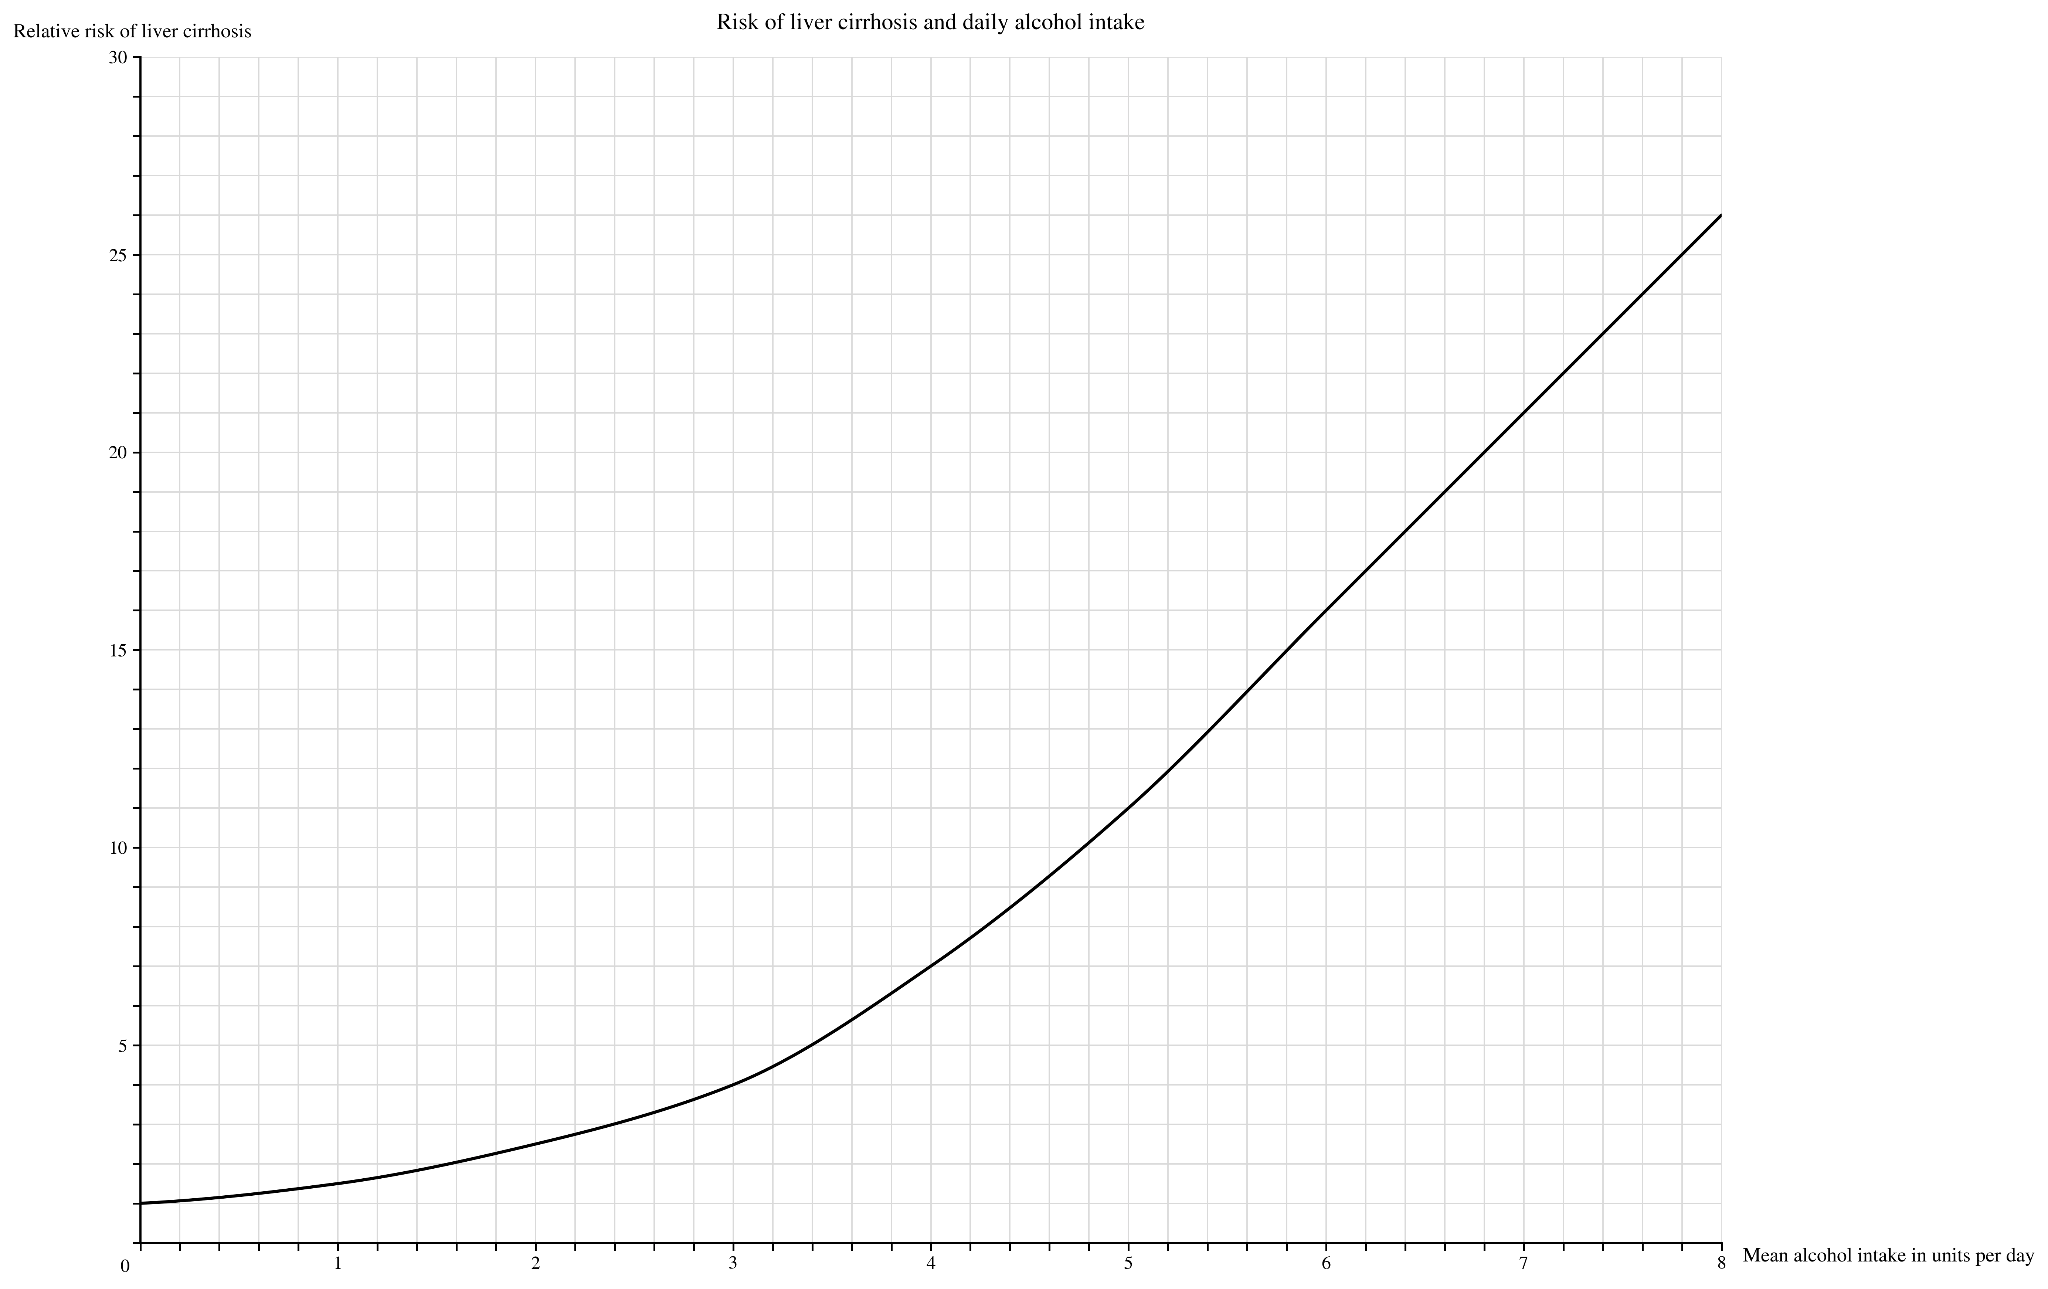
The Figure shows how the relative risk of liver cirrhosis changes with daily alcohol intake. A relative risk of 1 is the risk for a person who drinks no alcohol.
Figure
a.[1]
Give the relative risk of liver cirrhosis for a person who drinks 4 units of alcohol per day.
b.[2]
Calculate how many times greater the relative risk is at 6 units per day than at 2 units per day.
c.[2]
Describe the relationship shown in the Figure.
d.[2]
Explain why drinking large amounts of alcohol over many years can damage the liver.
e.[2]
Some people who drink 8 units of alcohol per day do not develop liver cirrhosis.
Explain why.
5.4 Non-communicable diseases Questions
44 exam-style questions on Edexcel GCSE Biology 5.4 Non-communicable diseases, covering 5.4.1 Interaction of factors in non-communicable disease, 5.4.2 Lifestyle factors and non-communicable disease, and 5.4.3 Treatments for cardiovascular disease. Each one has a worked solution and a mark scheme showing where the marks go.