The graph below shows the rates of glucose filtration, reabsorption, and excretion in the kidneys of a human subject as a function of plasma glucose concentration.
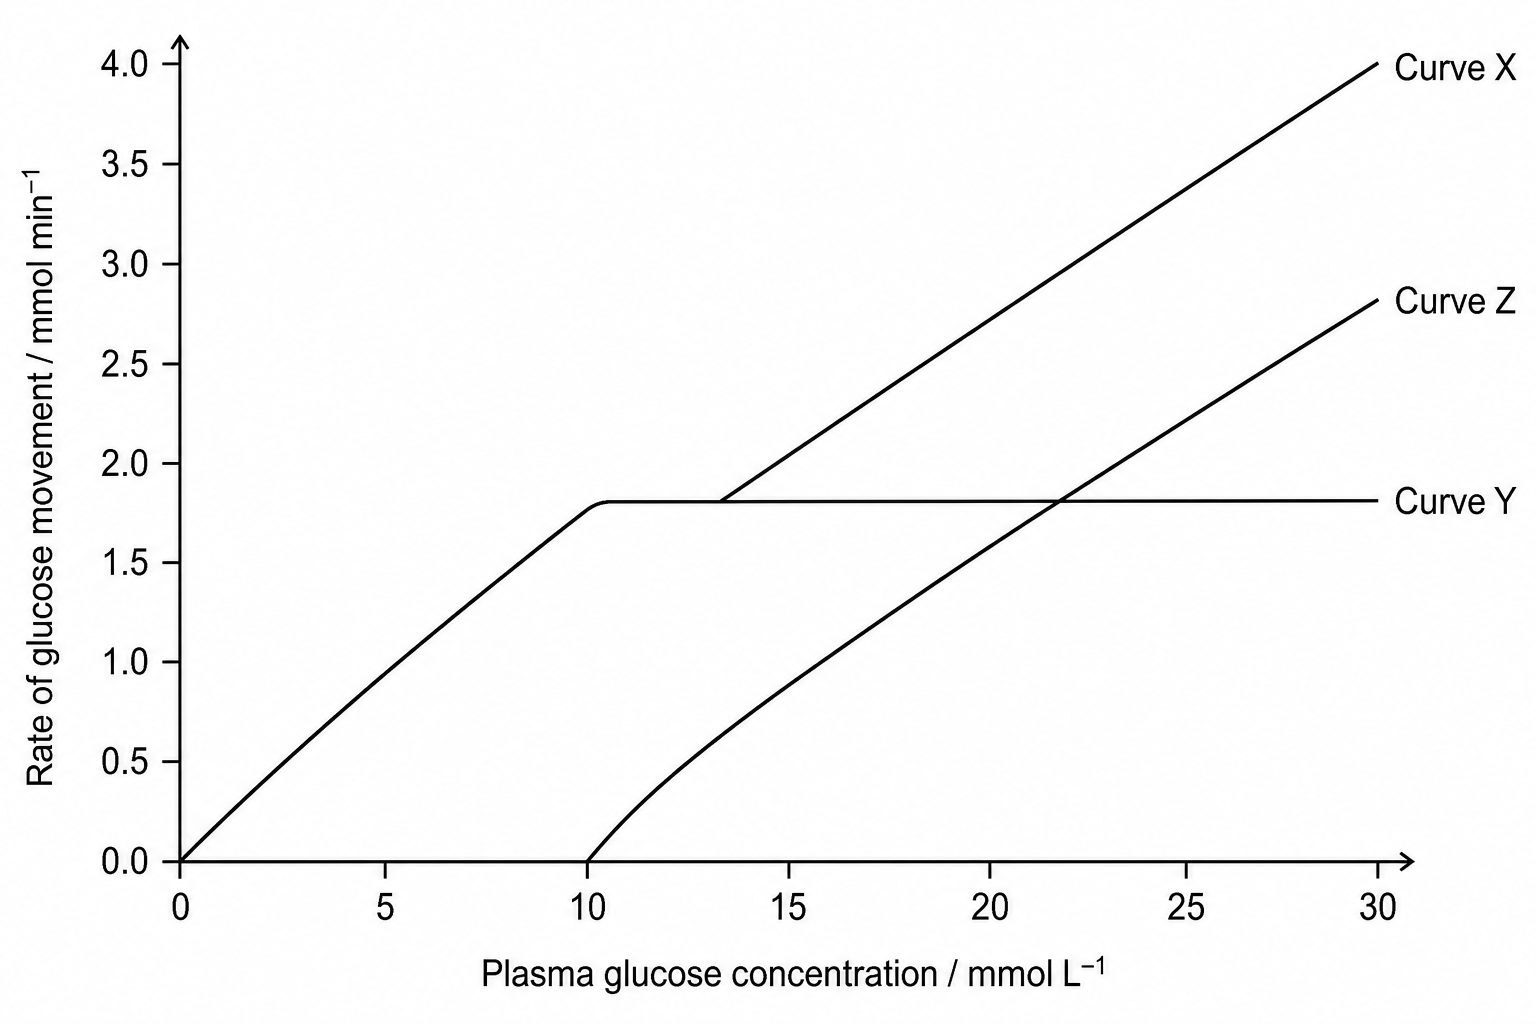
A patient with untreated Type 1 diabetes has a fasting plasma glucose concentration of 15 mmol L-1.
Which of the following correctly identifies each curve and explains the state of renal glucose handling in this patient?
Curve X: Filtration; Curve Y: Reabsorption. At 15 mmol⋅L−115\text{ mmol}\cdot\text{L}^{-1}15 mmol⋅L−1, the filtration rate exceeds the transport maximum (TmT_mTm) of the co-transporter proteins in the proximal convoluted tubule, resulting in glucose excretion (Curve Z).
Curve X: Reabsorption; Curve Y: Filtration. At 15 mmol⋅L−115\text{ mmol}\cdot\text{L}^{-1}15 mmol⋅L−1, insulin deficiency prevents glucose from entering the filtrate via ultrafiltration, keeping excretion (Curve Z) at zero.
Curve Y: Excretion; Curve Z: Reabsorption. At 15 mmol⋅L−115\text{ mmol}\cdot\text{L}^{-1}15 mmol⋅L−1, active excretion of glucose occurs in the loop of Henle to protect the medulla from osmotic shock.
Curve X: Filtration; Curve Z: Reabsorption. At 15 mmol⋅L−115\text{ mmol}\cdot\text{L}^{-1}15 mmol⋅L−1, the hydrostatic pressure in the glomerulus is too high, causing glucose to bypass the proximal convoluted tubule and be reabsorbed in the collecting duct.