Figure 1 shows how the concentration of glucose in a diabetic patient's blood changes over a 120-minute period following a subcutaneous insulin injection.
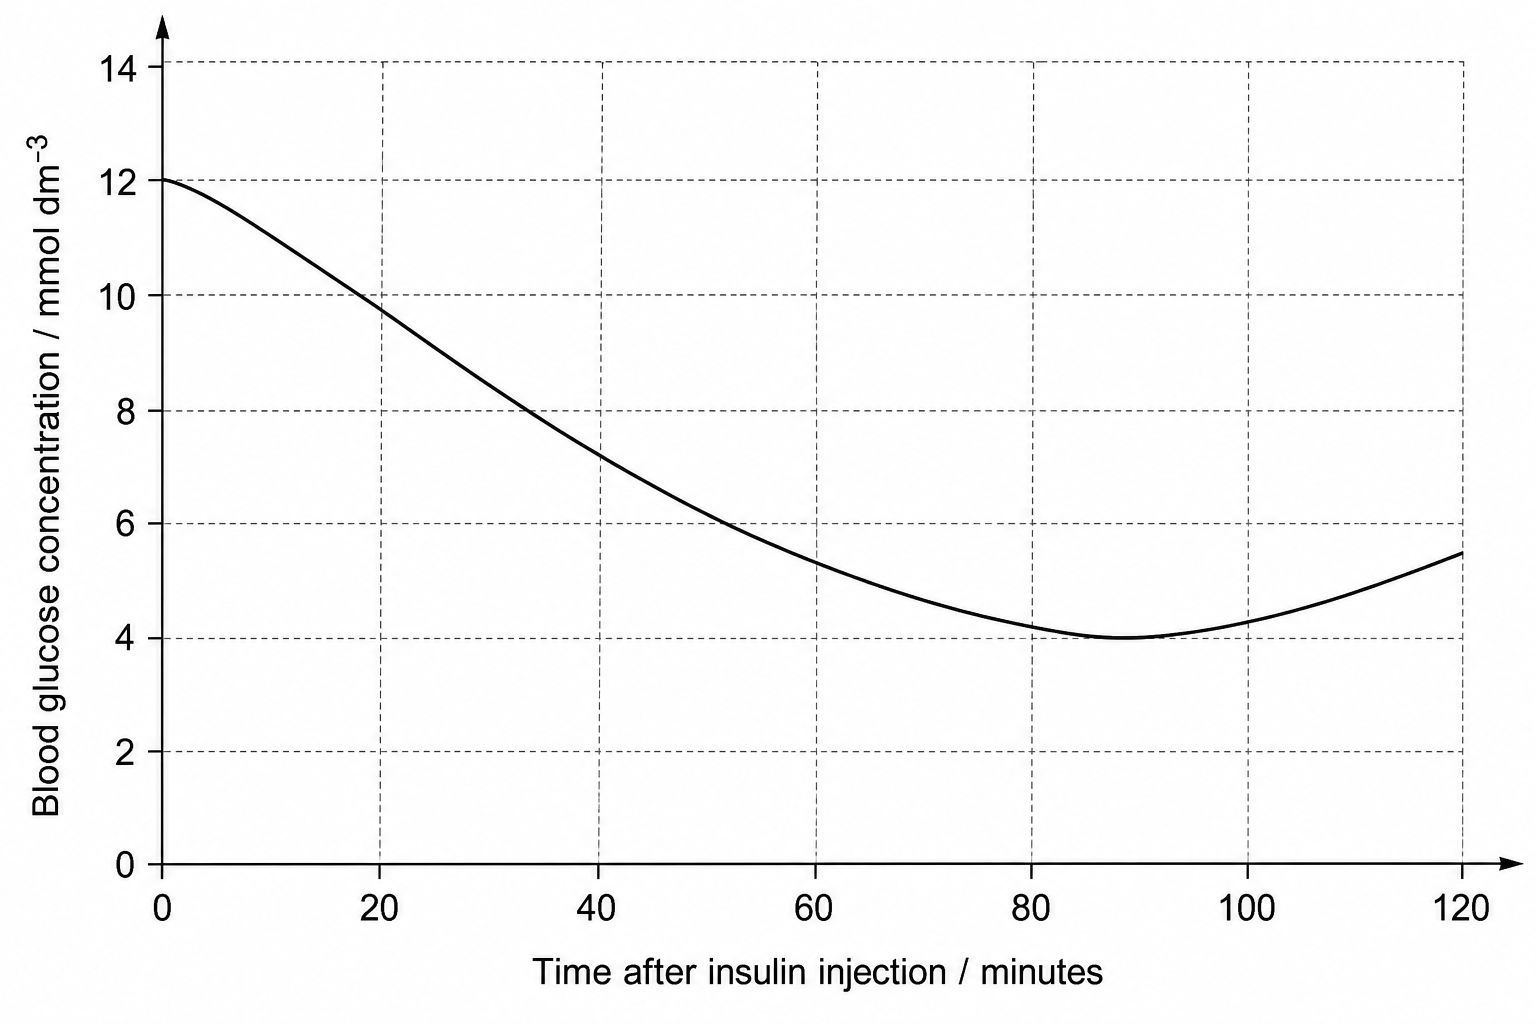
Describe the trends shown in Figure 1 from 0 minutes to 120 minutes.
Figure 1 shows how the concentration of glucose in a diabetic patient's blood changes over a 120-minute period following a subcutaneous insulin injection.
Describe the trends shown in Figure 1 from 0 minutes to 120 minutes.