A healthy adult volunteer participates in a nutritional trial. At 0 minutes, they ingest a carbohydrate-rich meal replacement shake. The graph in Figure 1 shows the subsequent changes in the concentration of glucose in their blood plasma over the next 120 minutes.
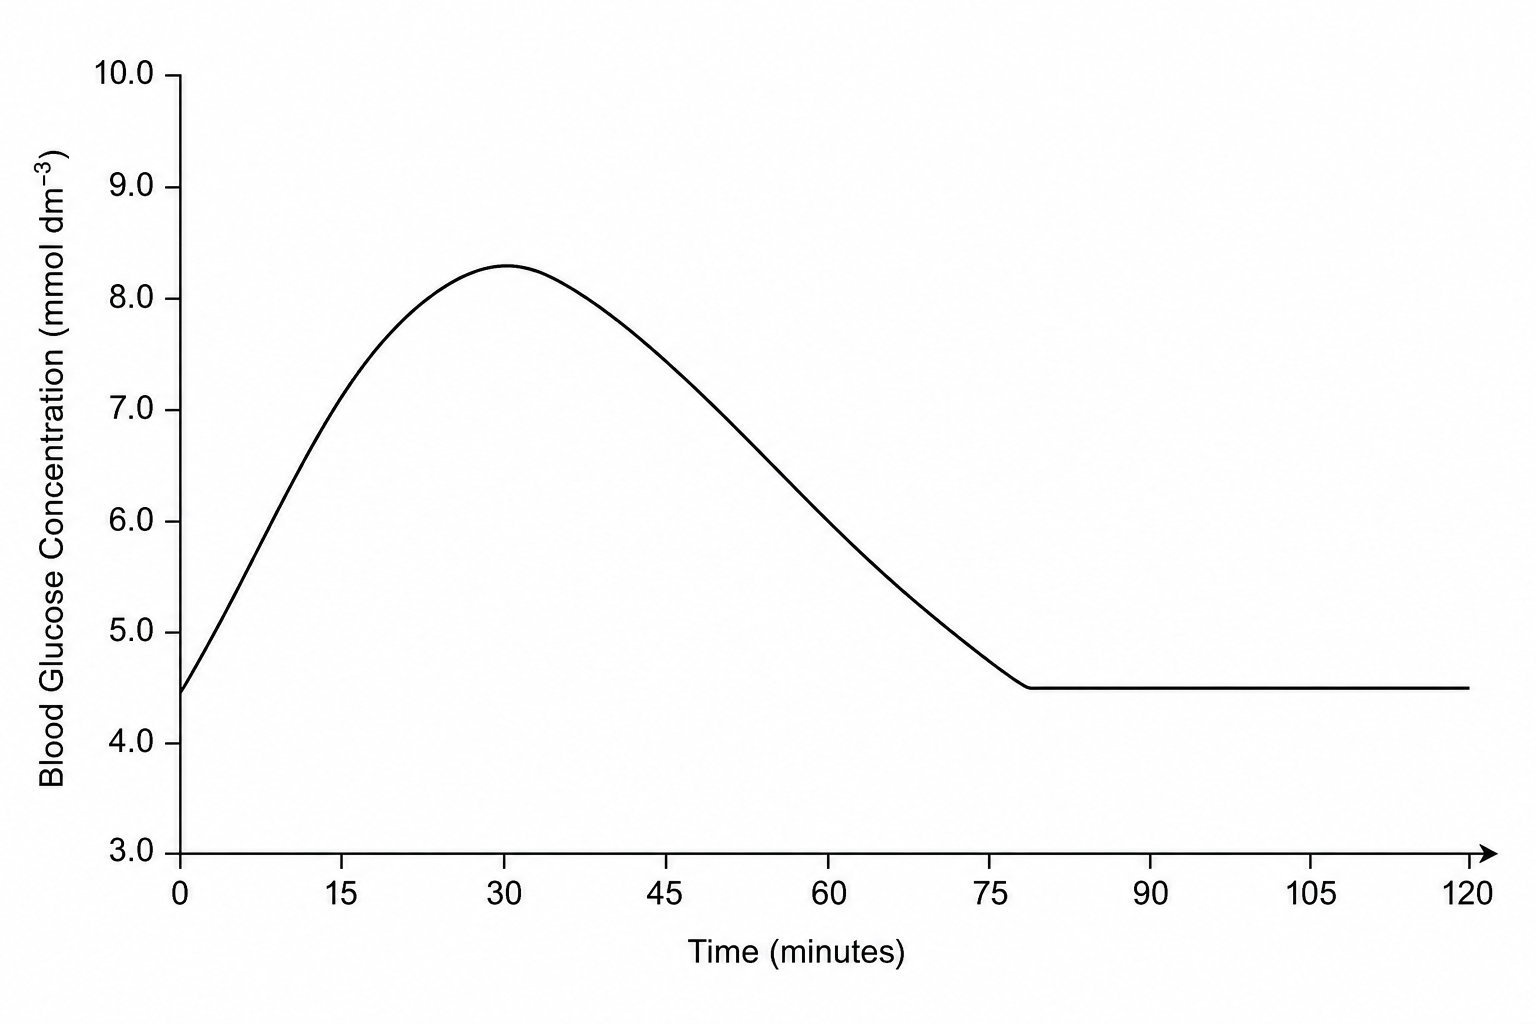
Explain why the concentration of glucose in the blood plasma decreases between 30 minutes and 75 minutes.