Two students conducted an experiment to investigate whether reaction times differ between a person's dominant hand and their non-dominant hand using the ruler drop test.
Table 1 shows some of their results:
Table 1: Distance the ruler fell before catching (in cm)
| Test | Dominant hand distance (cm) | Non-dominant hand distance (cm) |
|---|---|---|
| 1 | 14 | 18 |
| 2 | 11 | 21 |
| 3 | 15 | [To be completed] |
| 4 | 12 | [To be completed] |
| 5 | 13 | [To be completed] |
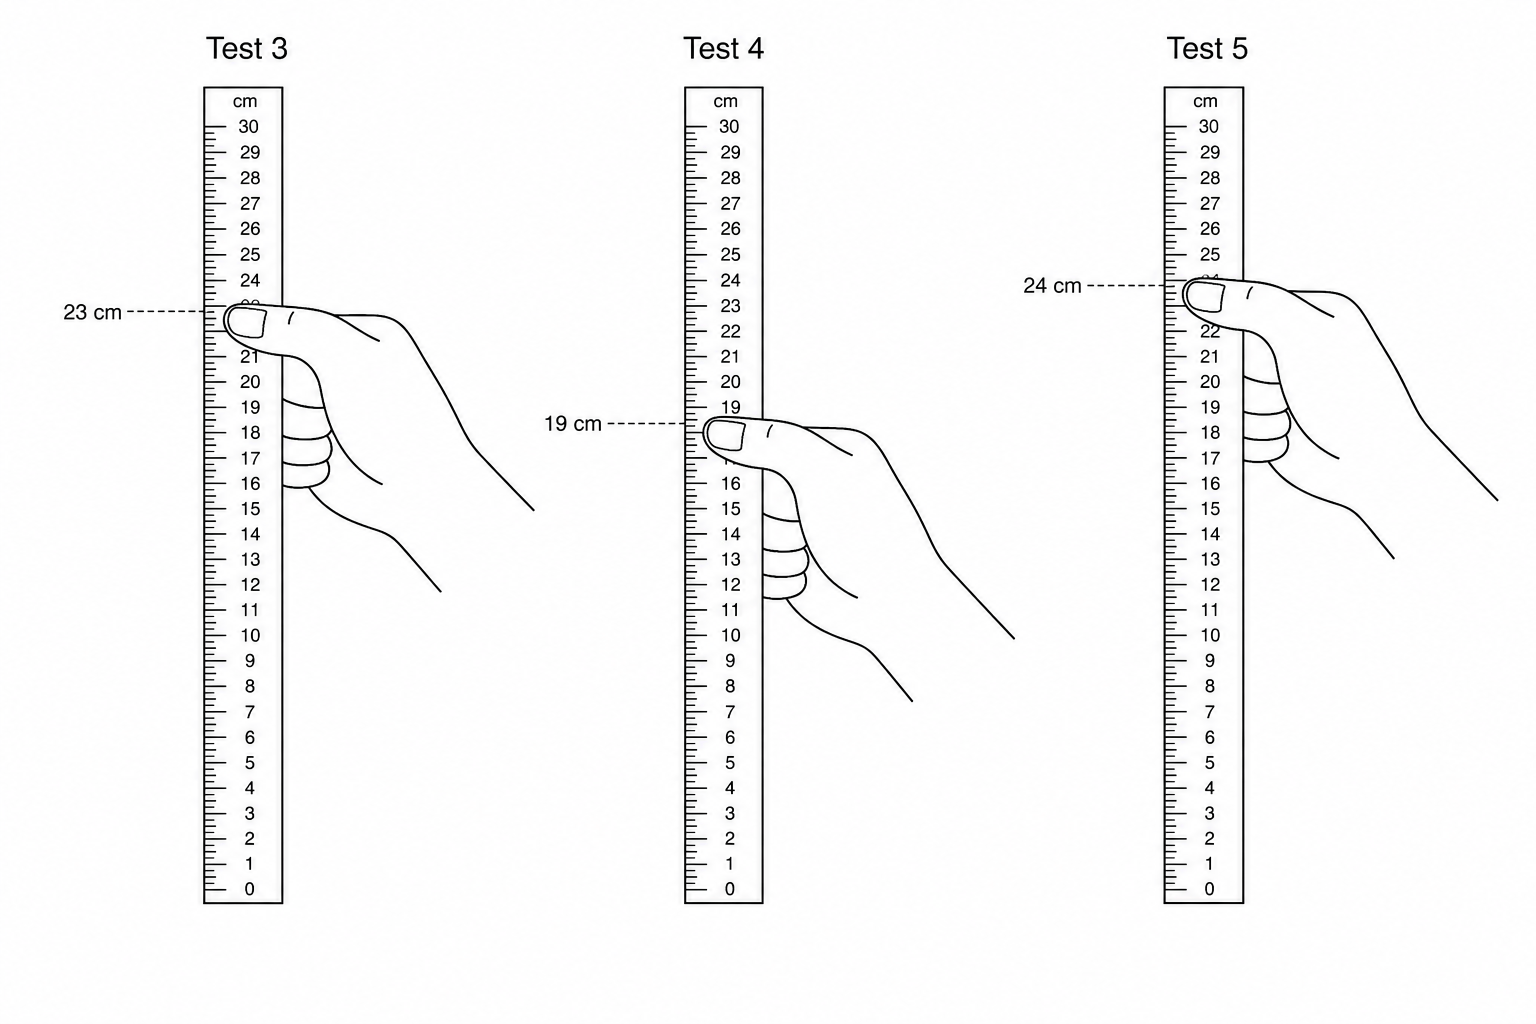
The results for Tests 3, 4, and 5 for the non-dominant hand are shown in the diagram below:
a.[3]
Complete Table 1 by finding the values for Tests 3, 4, and 5 for the non-dominant hand.
b.[2]
Calculate the mean distance the ruler fell for both the dominant hand and the non-dominant hand.
c.[2]
State the conclusion that can be made from these results and explain how the data supports it.
d.[2]
Suggest two ways the students could improve their investigation.