Question 2
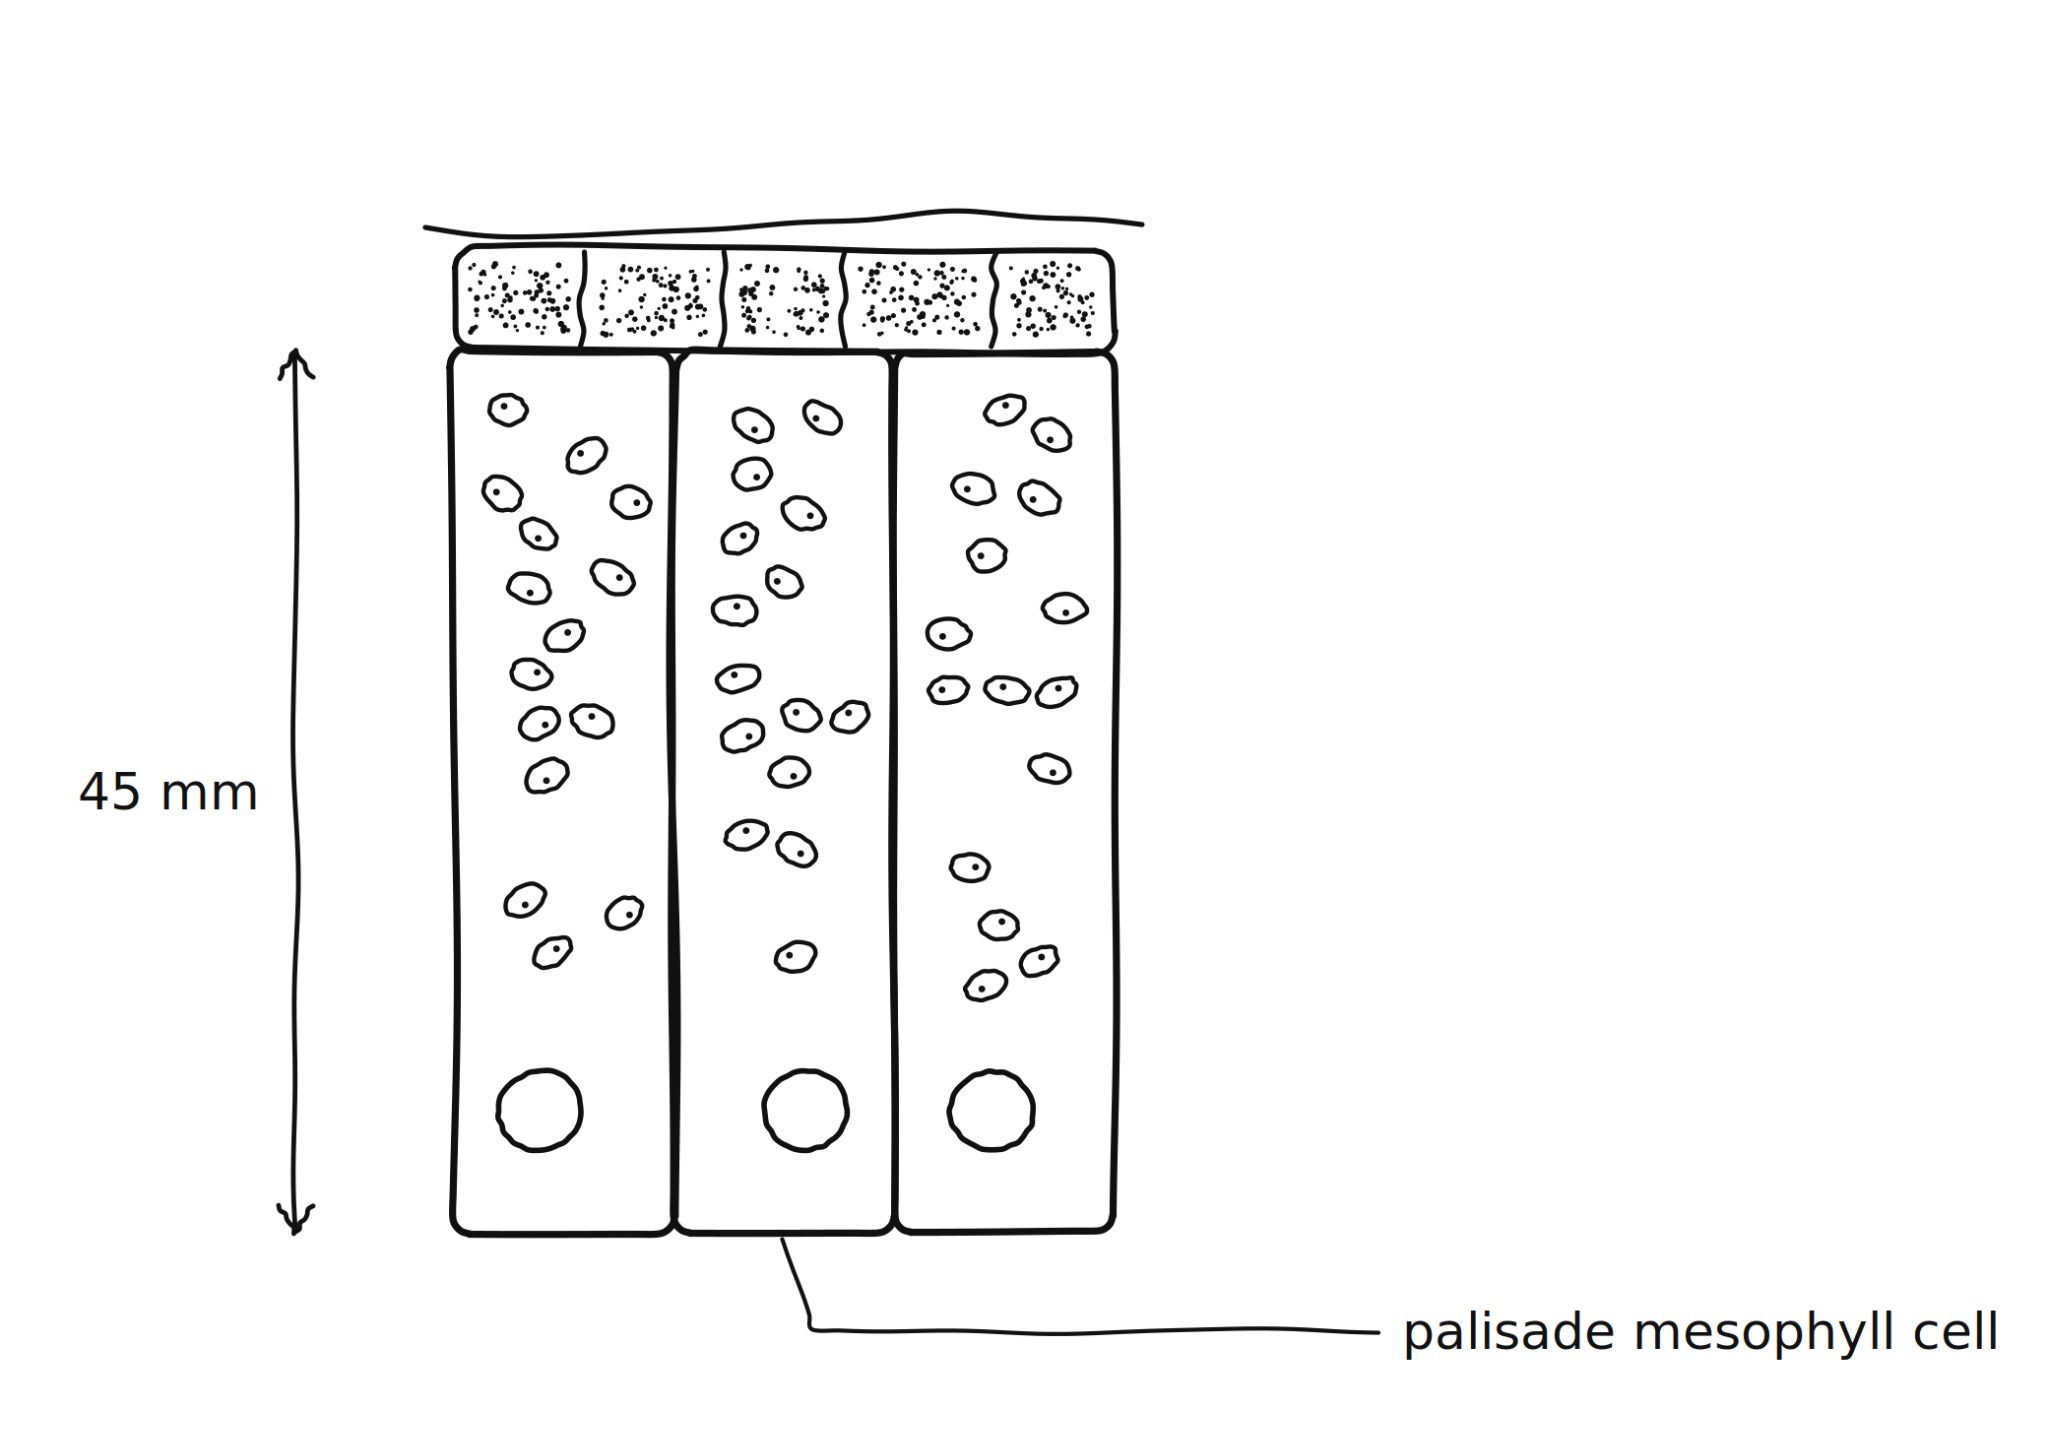
FA student used a light microscope to look at a thin section of a leaf. The figure shows the drawing she made of the palisade mesophyll. The magnification of her drawing is x900.
Figure: A student's drawing of part of the palisade mesophyll of a leaf, seen using a light microscope
a.[3]
Calculate the real length of the palisade cell. Give your answer in micrometres.
b.[3]
The palisade cells are long columns packed closely together at the top of the leaf. Explain how this increases the rate of photosynthesis in the leaf.
2.3 Plant tissues, organs and systems Questions
38 exam-style questions on AQA GCSE Biology 2.3 Plant tissues, organs and systems, covering 2.3.1 Plant tissues and 2.3.2 Plant organ system. Each one has a worked solution and a mark scheme showing where the marks go.