Reciprocal Graphs GCSE Maths: A Clear Guide
Reciprocal graphs GCSE maths made clear with simple rules, worked examples, common mistakes and focused exam-style questions for revision.
A reciprocal graph usually has an equation of the form y=axy=\frac{a}{x}y=xa. It has two separate curved branches, never crosses either axis and changes quadrants depending on whether aaa is positive or negative. That is the essential idea behind reciprocal graphs GCSE maths questions.
Yet these graphs can feel strange at first. Picture a student called Sam who can complete the table correctly, plot every coordinate and still lose marks because the final curve crosses an axis. The arithmetic is not the real problem. The graph behaves differently from the straight lines and quadratics Sam already knows.
The moment it clicks is usually quieter than expected: a reciprocal graph is not one continuous curve. It is two branches separated by values the function can never reach.
The reciprocal graph checklist
For a graph with equation y=axy=\frac{a}{x}y=xa:
- substitute each given value of xxx into the equation;
- plot the resulting coordinates accurately;
- draw two smooth branches rather than straight line segments;
- never join the branches across x=0x=0x=0;
- never let the curve touch either axis;
- check the quadrants using the sign of aaa.
If a>0a>0a>0, the branches appear in the first and third quadrants. If a<0a<0a<0, they appear in the second and fourth quadrants.
You can see the method taught alongside exam-style material in the Maths Genie cubic and reciprocal graphs lesson.
What makes a graph reciprocal?
The basic reciprocal function is:
y=1xy=\frac{1}{x}y=x1The word reciprocal means dividing 111 by a value. For example, the reciprocal of 444 is 14\frac{1}{4}41, while the reciprocal of 12\frac{1}{2}21 is 222.
In y=axy=\frac{a}{x}y=xa, the value of yyy depends on the reciprocal of xxx, scaled by the constant aaa.
When the positive value of xxx becomes larger, the value of yyy gets closer to 000. When xxx is a small positive number, yyy can become very large. The same pattern occurs with negative values on the other branch.
There is one crucial restriction:
x≠0x\ne 0x=0Division by 000 is undefined, so the graph cannot contain a point where x=0x=0x=0. This explains why the curve cannot cross the yyy-axis.
The curve also cannot cross the xxx-axis. If y=0y=0y=0, then ax\frac{a}{x}xa would have to equal 000. For any non-zero value of aaa, that cannot happen.
The axes are therefore asymptotes. The curve approaches them but never touches them.
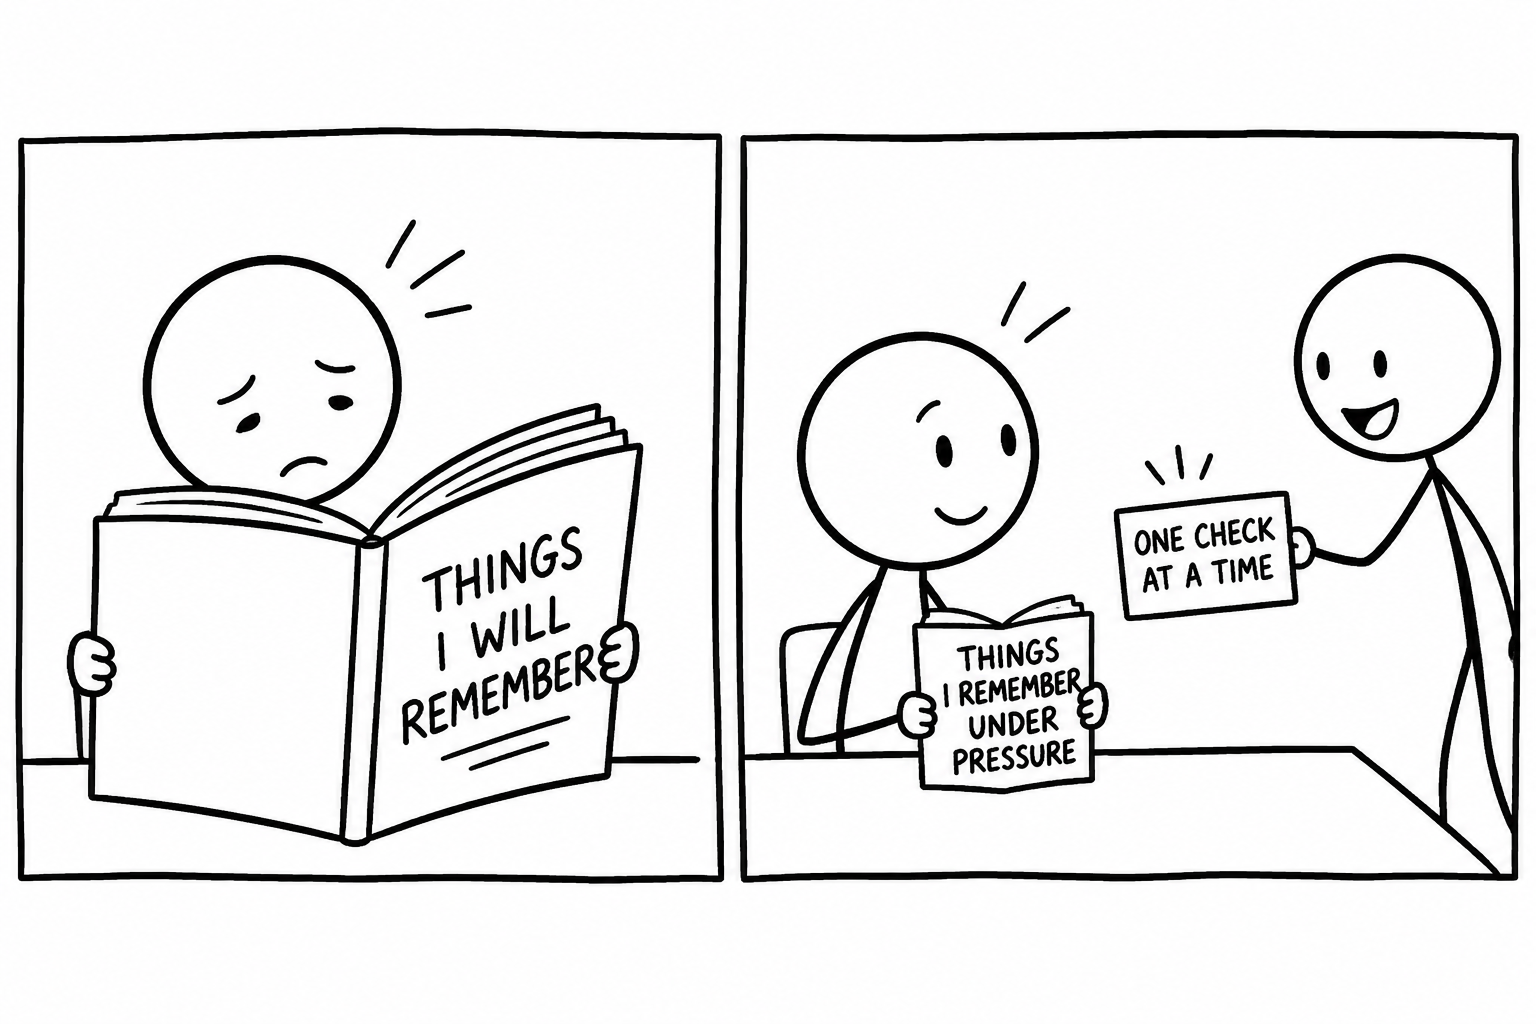 A tired revision student discovers that one check at a time is more useful than an enormous memory list
Reciprocal graphs worked examples
Drawing y=6xy=\frac{6}{x}y=x6
Suppose you are asked to draw:
y=6xy=\frac{6}{x}y=x6Start by completing a table of values.
| xxx | −6-6−6 | −3-3−3 | −2-2−2 | −1-1−1 | 111 | 222 | 333 | 666 |
|---|---|---|---|---|---|---|---|---|
| yyy | −1-1−1 | −2-2−2 | −3-3−3 | −6-6−6 | 666 | 333 | 222 | 111 |
For instance, when x=−3x=-3x=−3:
y=6−3=−2y=\frac{6}{-3}=-2y=−36=−2When x=2x=2x=2:
y=62=3y=\frac{6}{2}=3y=26=3Plot the coordinates, including (−3,−2)(-3,-2)(−3,−2) and (2,3)(2,3)(2,3). Then draw one smooth branch through the positive coordinates and another through the negative coordinates.
Because 666 is positive, the branches belong in the first and third quadrants. They should move closer to both axes without touching them.
This is where Sam's approach changes. Instead of thinking, “How do I remember this unusual shape?”, Sam checks three facts:
- x=0x=0x=0 is forbidden;
- y=0y=0y=0 is impossible;
- positive aaa means the first and third quadrants.
The shape then follows from the mathematics rather than memory.
Use the Maths Genie reciprocal graphs revision guide when you want to review this method, then open the reciprocal graphs Question Bank to practise applying it yourself.
Drawing y=−8xy=-\frac{8}{x}y=−x8
Now consider:
y=−8xy=-\frac{8}{x}y=−x8A few useful coordinates are:
| xxx | −8-8−8 | −4-4−4 | −2-2−2 | 222 | 444 | 888 |
|---|---|---|---|---|---|---|
| yyy | 111 | 222 | 444 | −4-4−4 | −2-2−2 | −1-1−1 |
A negative input produces a positive output, while a positive input produces a negative output. The branches therefore appear in the second and fourth quadrants.
The graph still cannot touch either axis. The negative sign changes the quadrants, not the rules about asymptotes.
Checking whether a point lies on a reciprocal graph
Does (4,3)(4,3)(4,3) lie on the graph:
y=12x?y=\frac{12}{x}?y=x12?Substitute x=4x=4x=4:
y=124=3y=\frac{12}{4}=3y=412=3The calculated value matches the coordinate, so (4,3)(4,3)(4,3) lies on the graph.
Now test (6,3)(6,3)(6,3):
y=126=2y=\frac{12}{6}=2y=612=2The output should be 222, not 333, so (6,3)(6,3)(6,3) does not lie on the graph.
A quick alternative is to use the relationship:
xy=axy=axy=aFor (4,3)(4,3)(4,3), 4×3=124\times 3=124×3=12. For (6,3)(6,3)(6,3), 6×3=186\times 3=186×3=18, so the second point cannot lie on y=12xy=\frac{12}{x}y=x12.
How reciprocal graphs questions are marked
A drawing question may provide a table, ask you to calculate missing values and then require a graph. Treat these as separate opportunities for marks.
First, show accurate substitution. Next, plot each coordinate using the graph's scale. Finally, draw smooth curves through the points.
Do not use a ruler to connect the coordinates. A reciprocal graph is curved, and its branches should flatten as they approach an axis. Do not draw across the gap at x=0x=0x=0.
When a question asks you to recognise a reciprocal graph, look for:
- two separate branches;
- axes acting as asymptotes;
- the first and third quadrants when a>0a>0a>0;
- the second and fourth quadrants when a<0a<0a<0;
- values satisfying xy=axy=axy=a.
You can print the Maths Genie cubic and reciprocal graphs question booklet or work through board-specific practice such as the AQA reciprocal graphs questions and Eduqas reciprocal graphs questions.
Common mistakes with reciprocal graphs
Substituting negative numbers incorrectly
For y=6xy=\frac{6}{x}y=x6 and x=−2x=-2x=−2:
y=6−2=−3y=\frac{6}{-2}=-3y=−26=−3Keep the negative sign visible throughout the calculation. A sign error can put a coordinate in the wrong quadrant.
Plotting a point at x=0x=0x=0
There is no output when x=0x=0x=0 because division by 000 is undefined. Leave a gap rather than inventing a coordinate.
Joining the branches
The two branches are separate. Joining them across the yyy-axis suggests that the function has values around x=0x=0x=0 that do not exist.
Touching the axes
The branches approach the axes but never reach them. Finish each curve by showing it continuing towards the axis, not landing on it.
Drawing straight line segments
Plotted points guide the curve, but they should not be joined with a ruler. Draw a smooth curve that becomes steep near the yyy-axis and flatter near the xxx-axis.
Exam-style practice to try
Try these without looking back at the worked examples:
- Complete a table and sketch y=10xy=\frac{10}{x}y=x10 for suitable positive and negative values of xxx.
- State which quadrants contain the graph of y=−5xy=-\frac{5}{x}y=−x5.
- Decide whether (−3,−4)(-3,-4)(−3,−4) lies on y=12xy=\frac{12}{x}y=x12.
- Find the missing coordinate in (k,2)(k,2)(k,2) if the point lies on y=14xy=\frac{14}{x}y=x14.
- Explain why a reciprocal graph of the form y=axy=\frac{a}{x}y=xa cannot cross either axis when a≠0a\ne 0a=0.
For the fourth question:
2=14k2=\frac{14}{k}2=k14Multiplying by kkk gives:
2k=142k=142k=14Therefore:
k=7k=7k=7The missing coordinate is (7,2)(7,2)(7,2).
Turn recognition into reliable exam marks
Sam's problem was not a lack of effort. It was relying on a remembered picture instead of checking the equation, signs and asymptotes. You now have those checks, but they become dependable only when you use them on several different questions.
Start the Maths Genie reciprocal graphs lesson, then turn the method into exam practice with the reciprocal graphs Question Bank.