GCSE Bengali Gender Gap Results: What Data Shows
GCSE Bengali gender gap results explained through national data, grade thresholds and careful statistical reading, with practical lessons for maths revision.
A results table can look decisive. One column is higher than another, so it is tempting to think the story is finished. But statistics rarely become useful until we ask what was counted, how the comparison was made and what the figures cannot tell us.
The latest national GCSE Bengali gender gap results show a clear descriptive pattern: female entrants achieve higher cumulative grade percentages than male entrants at the main reporting thresholds. That does not prove that gender causes the difference, nor does it predict what any individual student will achieve. It tells us how two groups of entrants performed in a particular examination series.
For maths students, this is more than an interesting education story. It is a practical lesson in percentages, denominators, grouped data and cautious interpretation, exactly the habits that strengthen answers in GCSE statistics questions.
The short answer
When reading the national figures, keep these conclusions in view:
- Female entrants have a higher proportion of results at the principal grade thresholds in GCSE Bengali.
- The comparison should be expressed in percentage points, not simply as a difference in candidate numbers.
- Entry totals matter because the male and female cohorts may not be the same size.
- National data describes a cohort; it does not explain why the pattern exists.
- Differences between years should be checked before calling any result a lasting trend.
- Official tables generally use administrative male and female categories, so the data is narrower than the everyday meaning of gender.
The key finding is therefore real but limited: there is an attainment gap in the reported results, while the results table alone cannot identify its causes.
What the national GCSE Bengali data measures
The latest completed national GCSE results series is summer 2025. The Joint Council for Qualifications publishes UK results tables by subject and candidate category, while Ofqual publishes detailed results information for England. These releases provide the most authoritative starting point for comparing outcomes.
GCSE Bengali is currently available through AQA. As with other GCSE subjects, outcomes are reported cumulatively. A percentage shown for grade 777 means the proportion receiving grades 777, 888 or 999, not only those receiving exactly grade 777. Likewise, the grade 444 threshold includes every result from grade 444 upwards.
This distinction matters. A cumulative table answers questions such as:
- What proportion achieved grade 444 or above?
- What proportion achieved grade 555 or above?
- What proportion achieved grades 777 to 999?
It does not immediately show the percentage receiving each individual grade. To find that, adjacent cumulative percentages would have to be compared.
The rate at any threshold is calculated as:
threshold rate=entrants at or above the thresholdtotal entrants in the group×100%\text{threshold rate}=\frac{\text{entrants at or above the threshold}}{\text{total entrants in the group}}\times 100\%threshold rate=total entrants in the groupentrants at or above the threshold×100%National tables show that the female threshold rate is higher than the male threshold rate across the main GCSE Bengali attainment measures. That is the statistical basis for describing a gender gap in outcomes.
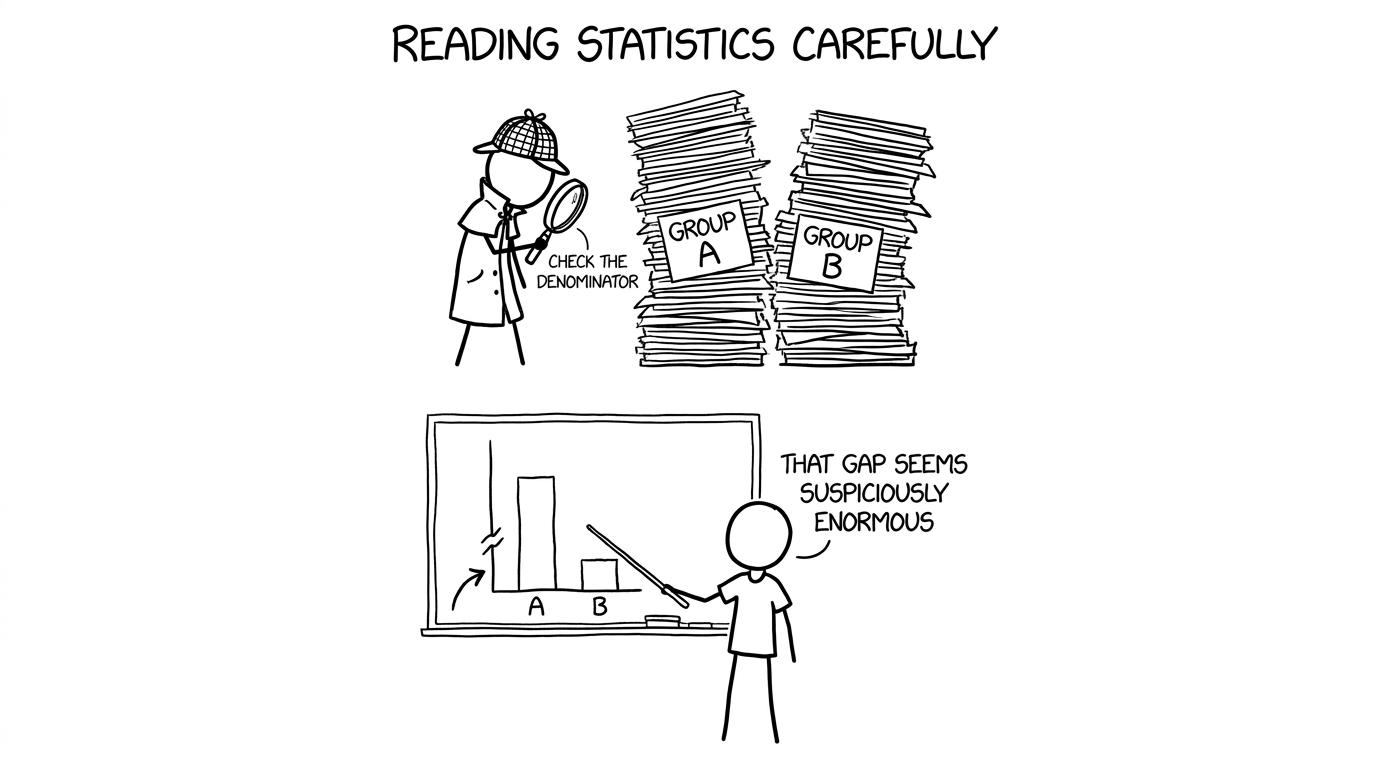 Stick-figure data detectives investigate a suspicious results chart
How large should we think the gap is?
A responsible interpretation begins with the unit. If the female rate and male rate are percentages, subtracting them gives a percentage-point difference:
percentage-point gap=female rate−male rate\text{percentage-point gap}=\text{female rate}-\text{male rate}percentage-point gap=female rate−male rateThis is not automatically the same as a percentage increase. A relative percentage comparison uses one group as a base:
relative difference=difference in rateschosen comparison rate×100%\text{relative difference}=\frac{\text{difference in rates}}{\text{chosen comparison rate}}\times 100\%relative difference=chosen comparison ratedifference in rates×100%Those calculations answer different questions. National results discussions normally become clearest when the gap is reported in percentage points and accompanied by the entry totals.
Candidate numbers matter because a larger group can produce more high grades even when its success rate is lower. Comparing raw totals without considering group size is one of the easiest ways to reach a false conclusion.
This is the same discipline developed through MathsGenie's GCSE maths revision resources: identify the quantity, choose the appropriate operation and keep the answer connected to its context.
Why the results do not prove a cause
The national tables reveal association, not causation. They do not tell us why female entrants recorded higher outcomes.
Several factors could be relevant to language results, including prior fluency, literacy experience, the balance of first-language and additional-language speakers, school entry policies, preparation time and differences between yearly cohorts. However, the published headline tables do not isolate these factors. Claiming that any one of them caused the gap would go beyond the evidence.
Selection is especially important. GCSE Bengali entrants are not a random sample of all teenagers. Students enter because the subject is available, suitable and chosen by them or their school. The male and female groups may therefore differ in ways that are not visible in a results table.
There is also a language issue around the word “gender”. Official examination data commonly reports categories labelled male and female using administrative records. This does not necessarily capture gender identity in all its detail. “Gender gap” is a familiar search term, but the categories and methodology of the source should always be stated accurately.
A careful conclusion sounds less dramatic, but it is more useful: female entrants had higher reported attainment rates, and further evidence would be required to explain the difference.
What this has to do with GCSE maths
Statistics questions reward students who resist the first obvious answer. The skill is not merely calculating correctly. It is knowing whether the calculation answers the question being asked.
Check the denominator
Percentages are meaningful only when their base is understood. Here, each group’s denominator is its own number of entrants. If the group sizes differ, raw counts and percentages can tell different stories.
Distinguish outcomes from entries
A chart may show how many students entered Bengali, how many reached a threshold or what percentage achieved it. These are three distinct measures. Read titles, axes and table headings before comparing values.
Look for variation over time
One examination series is a snapshot. Several consecutive years provide better evidence of persistence, although even a repeated pattern does not establish causation. Changes in cohort composition, assessment conditions or entry practices can affect comparisons.
Match evidence to language
Words such as “shows”, “suggests” and “causes” are not interchangeable. A table can show a difference and perhaps suggest a pattern. On its own, it cannot demonstrate the mechanism behind that pattern.
These habits transfer directly to probability, averages, frequency tables and data interpretation. Students can organise their next steps by grade through the grade 444 revision topics, grade 555 revision topics and grade 777 revision topics. Those pages combine revision lessons with practice questions, answers and video support.
A practical checklist for reading results claims
Before accepting a headline about an attainment gap, ask:
- Who is included? Check the country, qualification, subject and examination year.
- What categories are used? Confirm how the source defines the groups.
- Is the figure a count or a percentage? Never treat them as equivalent.
- What is the denominator? Identify the total behind each percentage.
- Is the threshold cumulative? Grade 777 or above is different from grade 777 alone.
- How many years are shown? A single year cannot establish a stable trend.
- Does the evidence show association or causation? Results tables generally show the former.
- Are group sizes supplied? Small or unequal cohorts need careful interpretation.
That checklist is useful far beyond Bengali. It applies whenever a newspaper, school report or social media post turns a complicated dataset into a simple claim.
 Two stick-figure students discover that good practice habits meet at the top of the same revision mountain
Turning the insight into better maths revision
The most valuable response to national results is not to compare yourself with a demographic average. It is to improve the parts of your preparation that you can control.
Begin with one topic and complete questions without looking at the solution. Mark the work carefully. Record whether each lost mark came from missing knowledge, an incorrect method, weak interpretation or a careless error. That creates a personal dataset far more useful to your next revision session than a national average.
Once individual topics feel secure, move to full GCSE maths past papers. Past papers reveal whether you can select methods when the topic is not announced in advance. Use the mark schemes and video solutions to understand why marks were lost rather than merely recording the final score.
Closer to the examination, MathsGenie's GCSE predicted papers can add fresh timed practice. They should complement, not replace, official past papers and specification-led revision. Students aiming at the top end can also use the grade 999 revision topics to find demanding questions that expose small gaps in reasoning.
The principle is quiet but powerful: collect evidence, interpret it honestly, then act on it.
Common mistakes when interpreting the gender gap
Treating percentage points as percentages
Subtracting two attainment rates produces a percentage-point gap. Calling it a percentage difference without defining the base makes the comparison ambiguous.
Comparing numbers without cohort sizes
More students achieving a grade does not necessarily mean a higher achievement rate. The larger cohort may simply contain more entrants.
Reading a cumulative threshold as one grade
A grade 777 threshold normally includes grades 777 to 999. It should not be described as the proportion receiving exactly grade 777.
Assuming the result applies to every student
Group averages do not determine individual performance. They describe distributions, not destinies.
Inventing an explanation
The result tables do not measure every factor that might influence attainment. Plausible explanations still require evidence.
Generalising across subjects or exam boards
A pattern in GCSE Bengali cannot automatically be transferred to GCSE maths, other languages or every board. Specifications, cohorts and entry patterns differ. For maths preparation, use resources relevant to your board and tier, then confirm details against the current specification.
Read the data, then focus on your next mark
The national evidence supports a measured conclusion: female GCSE Bengali entrants have higher attainment percentages than male entrants at the main reported grade thresholds. It is reasonable to call this a results gap. It is not reasonable to treat the gap as proof of ability, motivation or a single underlying cause.
That distinction is the heart of good statistics. Numbers become informative when their definitions, denominators and limitations remain attached.
For your own GCSE maths preparation, start with MathsGenie's free GCSE revision programme, strengthen individual topics with practice questions and mini tests, and then test your decisions under timed conditions using past papers and mark schemes. Add predicted papers, video solutions and a realistic revision plan as the exam approaches. National data can describe a cohort. Your next revision choice is what changes your own result.