Common Mistakes with Reciprocal Graphs in GCSE Maths
Common mistakes with reciprocal graphs in GCSE Maths, with clear worked examples, plotting checks and exam-style practice to help students keep marks.
A reciprocal graph can look almost right and still lose marks. One incorrect negative value moves a point into the wrong quadrant. One attempt to substitute x=0x=0x=0 creates an impossible coordinate. Then a ruler turns a smooth curve into straight lines.
The common mistakes with reciprocal graphs in GCSE Maths usually involve substitution, signs, plotting or shape. A reliable method is to calculate carefully, check the quadrants and draw two smooth branches that approach, but never touch, the axes.
A quick reciprocal graph checklist
For a reciprocal function of the form
y=ax,a≠0,y=\frac{a}{x}, \qquad a\ne 0,y=xa,a=0,use this checklist:
- Substitute each given value of xxx carefully.
- Keep negative signs visible throughout.
- Never plot a coordinate at x=0x=0x=0.
- Check both axis scales before plotting.
- Check which quadrants contain the branches.
- Draw separate, smooth curves approaching the axes.
The axes are asymptotes: lines that the branches approach. Here, the vertical asymptote is x=0x=0x=0 and the horizontal asymptote is y=0y=0y=0.
Mistake: treating the fraction as subtraction
When you see y=6xy=\frac{6}{x}y=x6, reading quickly can lead you to calculate 6−x6-x6−x. The fraction bar means division, so write the substitution before calculating.
When x=3x=3x=3,
y=63=2.y=\frac{6}{3}=2.y=36=2.The coordinate is (3,2)(3,2)(3,2). When x=−3x=-3x=−3,
y=6−3=−2.y=\frac{6}{-3}=-2.y=−36=−2.This gives (−3,−2)(-3,-2)(−3,−2). Keeping the denominator visible helps you check both the operation and the sign. It also leaves a clear calculation to revisit if your plotted point looks unusual.
Mistake: losing negative signs
For a positive constant divided by a negative value, the answer is negative. For y=6xy=\frac{6}{x}y=x6, the values are:
| xxx | −6-6−6 | −3-3−3 | −2-2−2 | −1-1−1 | 111 | 222 | 333 | 666 |
|---|---|---|---|---|---|---|---|---|
| yyy | −1-1−1 | −2-2−2 | −3-3−3 | −6-6−6 | 666 | 333 | 222 | 111 |
The negative coordinates belong in the third quadrant, while the positive coordinates belong in the first quadrant.
More generally:
- If a>0a>0a>0, the branches occupy the first and third quadrants.
- If a<0a<0a<0, the branches occupy the second and fourth quadrants.
A plotted point such as (−3,2)(-3,2)(−3,2) therefore cannot belong to y=6xy=\frac{6}{x}y=x6.
Use the Drawing Other Graphs lesson and GCSE question bank to practise checking signs before drawing.
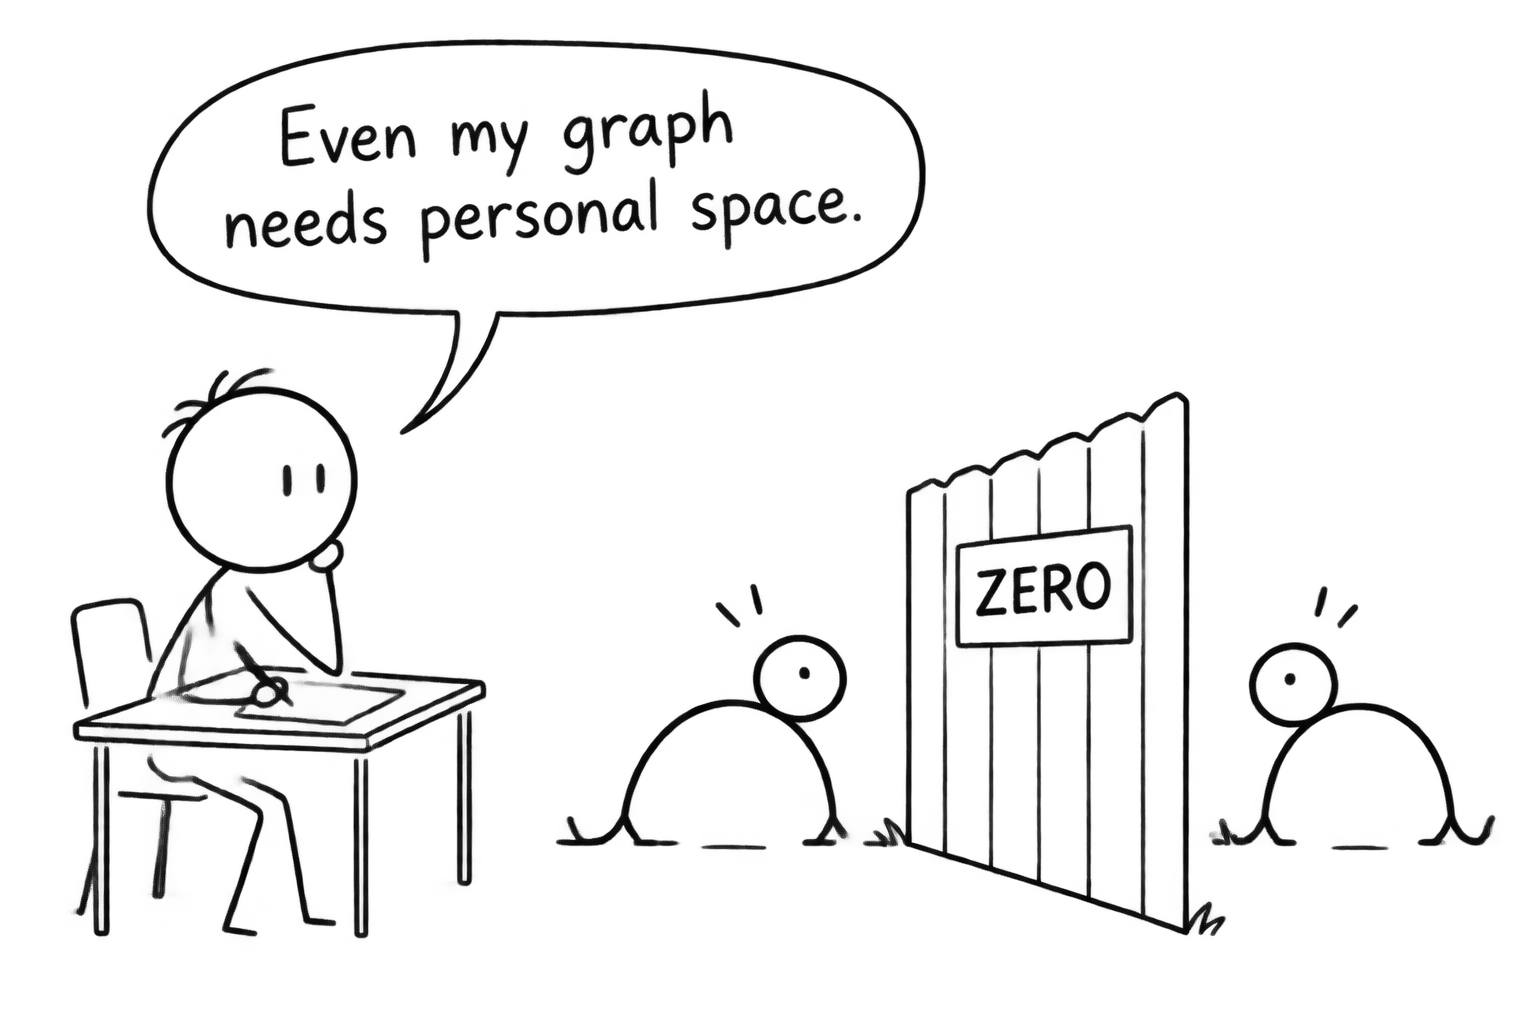 A student discovers that the two branches of a reciprocal graph value their personal space
Mistake: substituting zero
If a table includes x=0x=0x=0, the expression
y=60y=\frac{6}{0}y=06is undefined. There is no coordinate to plot. Write “undefined” in the table rather than entering zero or drawing a point on the vertical axis.
The graph cannot reach y=0y=0y=0 either. No finite, non-zero value of xxx makes 6x\frac{6}{x}x6 equal to zero. As ∣x∣|x|∣x∣ increases, the curve approaches the horizontal axis without reaching it.
Keep both ideas separate: division by zero explains the missing input, while the fraction never equalling zero explains the missing output.
Mistake: joining points with straight lines
A table provides selected points on a curve. It does not tell you to connect them with straight sections.
Sketch a smooth branch through each group of coordinates. Do not connect the branches across x=0x=0x=0, where the function is undefined. Avoid sharp corners or hooks that turn back towards an axis.
The cubic and reciprocal graphs stage lesson provides further practice. OCR students can also use the OCR reciprocal graphs lesson.
Mistake: ignoring the sign of the constant
Consider
y=−8x.y=-\frac{8}{x}.y=−x8.Copying the position of the branches of y=1xy=\frac{1}{x}y=x1 would give the wrong graph. When x=−4x=-4x=−4,
y=−8−4=2.y=-\frac{8}{-4}=2.y=−−48=2.When x=2x=2x=2,
y=−82=−4.y=-\frac{8}{2}=-4.y=−28=−4.The coordinates (−4,2)(-4,2)(−4,2) and (2,−4)(2,-4)(2,−4) belong in the second and fourth quadrants. Predicting these quadrants before calculating gives you an independent check afterwards.
Mistake: plotting accurate values inaccurately
Check the scale on each axis separately. The horizontal and vertical scales may use different intervals, even when the grid squares look identical.
For (3,2)(3,2)(3,2), locate x=3x=3x=3 horizontally, then y=2y=2y=2 vertically. Reversing that order changes the point.
Choose points spread across each branch when the question allows you to select values. Points closer to x=0x=0x=0 reveal the steep section; larger values of ∣x∣|x|∣x∣ show the curve flattening. If a point falls outside the grid, do not squeeze it onto the edge. Check your calculation and use suitable visible points.
A complete worked example
Sketch
y=12xy=\frac{12}{x}y=x12using x=−6,−3,−2,2,3,6x=-6,-3,-2,2,3,6x=−6,−3,−2,2,3,6.
Substitution gives
(−6,−2), (−3,−4), (−2,−6), (2,6), (3,4), (6,2).(-6,-2),\ (-3,-4),\ (-2,-6),\ (2,6),\ (3,4),\ (6,2).(−6,−2), (−3,−4), (−2,−6), (2,6), (3,4), (6,2).Because 12>012>012>0, the branches belong in the first and third quadrants. Plot the coordinates and draw two smooth curves approaching both axes.
A further check comes from rearranging the equation:
xy=12.xy=12.xy=12.Multiplying each coordinate pair should therefore give the same constant. This checks your arithmetic, although you must still check your plotting separately.
Common mistakes checklist before you finish
Pause before moving to the next question. Check the division, every negative sign, both scales and the quadrant positions. Then inspect the shape: two separate smooth branches, with neither touching an axis.
If something looks wrong, return to the table before redrawing everything. A single incorrect coordinate can distort an otherwise sensible curve. Correct that value first, then adjust only the affected branch.
For further practice, try the AQA reciprocal graphs exam booklet or reciprocal graphs question one and its worked solution.
Turn the corrected method into reliable marks
Use a repeatable sequence: calculate, check signs, plot and sketch. After marking a question, identify whether any error came from arithmetic, coordinates or drawing. Then attempt another question without looking at the solution.
MathsGenie’s free revision lessons, practice questions, mark schemes and video solutions help you turn that feedback into a more dependable method. Start with one reciprocal graph, check it carefully and build from there.