A-Level Maths Statistics Mock Revision Guide
A-Level Maths statistics mock revision made focused: diagnose weak topics, practise worked examples and build a targeted paper with MathsGenie for mocks.
Mock season often begins with a familiar problem: a statistics folder full of distributions, hypothesis tests and data, with no obvious place to start.
Effective A-Level Maths statistics mock revision starts with a short diagnostic paper, followed by targeted practice on the topics costing you marks. Then return to timed questions and check whether the gap has closed.
Statistics questions test more than calculator fluency. You must choose a model, calculate accurately and interpret the result in context. A correct probability without a suitable conclusion can still leave marks behind.
Your statistics mock revision checklist
Check your exam board specification before building a timetable. Edexcel, AQA, OCR and Eduqas organise content differently. Your preparation may include:
- sampling methods and data collection
- measures of location and spread
- correlation and regression
- probability rules
- the binomial distribution
- the normal distribution
- statistical hypothesis testing
- interpretation of a large data set
Use the MathsGenie A-Level statistics revision resources for lessons and exam-style questions, checking that each topic matches your specification.
For each topic, ask:
- Can I recognise when the method applies?
- Can I use my calculator accurately?
- Can I show sufficient working?
- Can I interpret the answer in context?
- Can I finish under timed conditions?
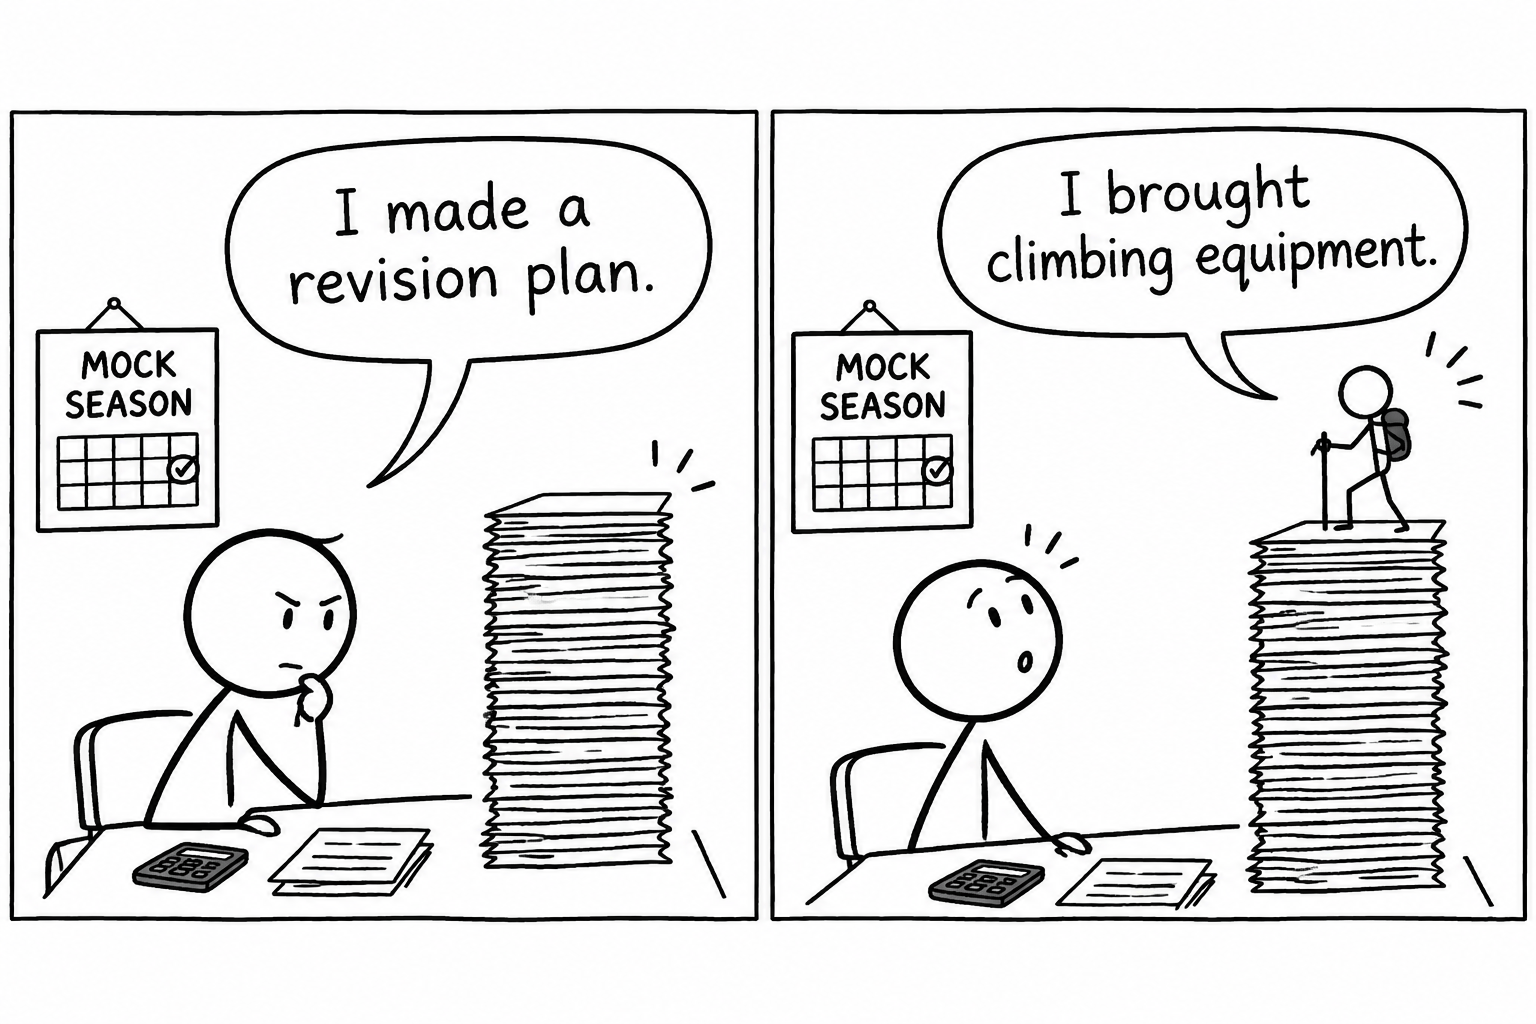 A sixth-form student discovers that a revision plan may require climbing equipment
Follow the evidence from your first mock
After a short statistics paper, the pattern of lost marks matters more than the score alone. Perhaps errors cluster around choosing tails, calculating normal probabilities or explaining conclusions. A mock becomes useful when those patterns guide your next session.
Classify each error:
- Knowledge: you did not know the method.
- Selection: you chose the wrong method.
- Accuracy: arithmetic or calculator input failed.
- Communication: your conclusion was incomplete.
- Timing: you could answer, but too slowly.
Use this evidence to allocate revision time. Maintain secure topics with occasional mixed practice and concentrate on weaknesses until the process feels familiar.
MathsGenie provides hypothesis testing lessons and exam questions, alongside this AQA statistical hypothesis testing problem. Use worked solutions to locate where your reasoning diverged.
Worked example: a binomial hypothesis test
Suppose a student claims that a coin is biased towards heads. The coin is tossed 101010 times and produces 888 heads. Test the claim at the 5%5\%5% significance level, assuming independent tosses with a constant probability of heads.
Let XXX be the number of heads. The null hypothesis is:
H0:p=0.5H_0:p=0.5H0:p=0.5The claim suggests a one-tailed alternative:
H1:p>0.5H_1:p>0.5H1:p>0.5Under H0H_0H0:
X∼B(10,0.5)X\sim\operatorname{B}(10,0.5)X∼B(10,0.5)Calculate the probability of obtaining 888 or more heads:
P(X≥8)=P(X=8)+P(X=9)+P(X=10)=(108)(0.5)10+(109)(0.5)10+(1010)(0.5)10=561024=0.0546875.\begin{aligned} P(X\geq 8) &=P(X=8)+P(X=9)+P(X=10)\\ &=\binom{10}{8}(0.5)^{10}+\binom{10}{9}(0.5)^{10}+\binom{10}{10}(0.5)^{10}\\ &=\frac{56}{1024}\\ &=0.0546875. \end{aligned}P(X≥8)=P(X=8)+P(X=9)+P(X=10)=(810)(0.5)10+(910)(0.5)10+(1010)(0.5)10=102456=0.0546875.Since
0.0546875>0.05,0.0546875>0.05,0.0546875>0.05,we do not reject H0H_0H0. There is insufficient evidence at the 5%5\%5% significance level to support the claim that the coin is biased towards heads.
The conclusion connects the probability to the claim without suggesting that H0H_0H0 has been proved. Practise the model using the binomial distribution question bank and videos.
Worked example: a normal distribution probability
Suppose journey times, in minutes, are modelled by
X∼N(70,82).X\sim\operatorname{N}(70,8^2).X∼N(70,82).Find the probability that a randomly selected journey takes more than 828282 minutes.
Standardising gives
Z=82−708=1.5.Z=\frac{82-70}{8}=1.5.Z=882−70=1.5.Therefore,
P(X>82)=P(Z>1.5)=1−Φ(1.5)≈0.0668.\begin{aligned} P(X>82) &=P(Z>1.5)\\ &=1-\Phi(1.5)\\ &\approx 0.0668. \end{aligned}P(X>82)=P(Z>1.5)=1−Φ(1.5)≈0.0668.The probability is approximately 0.06680.06680.0668, or 6.68%6.68\%6.68%.
A sketch helps identify the upper tail, even when your calculator performs the calculation. Try this OCR normal distribution exam question for further practice.
Turn revision into a weekly mock-season routine
Begin with retrieval
Recall conditions, notation and interpretations without notes. Ask when a binomial model is appropriate, what significance level means and how standard deviation affects a normal distribution's shape.
Practise one weak skill deeply
Complete focused questions. If averages and spread cause difficulty, use the mean and standard deviation revision lesson. Mark each answer and correct your reasoning, rather than copying the final value.
Mix the topics
Topic practice teaches a method. Mixed practice teaches you to recognise it when the question does not announce which chapter you need. Include familiar topics so that choosing between methods becomes part of the task.
Finish with timed work
Complete a short section without notes. Check calculator settings, show working and reread contextual conclusions. As the mock approaches, include complete papers and use mark schemes to assess method and communication.
Common mistakes in statistics mocks
Choosing the wrong tail
Translate the claim into an alternative hypothesis first. An increased proportion suggests H1:p>p0H_1:p>p_0H1:p>p0; a changed proportion suggests H1:p≠p0H_1:p\neq p_0H1:p=p0.
Treating correlation as causation
Correlation describes association. It does not establish causation; another variable may affect both quantities.
Ignoring context
Explain what rejecting or not rejecting the null hypothesis means for the claim being tested. Use the population and parameter named in the question.
Rounding too early
Retain calculator precision during intermediate steps and round at the end unless instructed otherwise. Early rounding can affect decisions near a critical boundary.
Forgetting model assumptions
A binomial model requires a fixed number of independent trials, two outcomes per trial and constant success probability. For regression, be cautious about extrapolating far beyond observed data.
Build the next paper around your weak topics
The first paper exposes weaknesses, focused practice addresses them, and a second timed attempt checks whether improvement holds without support.
Start with MathsGenie's free lessons, question banks, worked solutions and videos. Then use the MathsGenie Mock Exam Builder to build targeted practice around topics needing attention.
Keep a brief error log and revisit corrected questions after a gap. Your next paper should show whether you can now select the method, calculate accurately and explain the result independently.