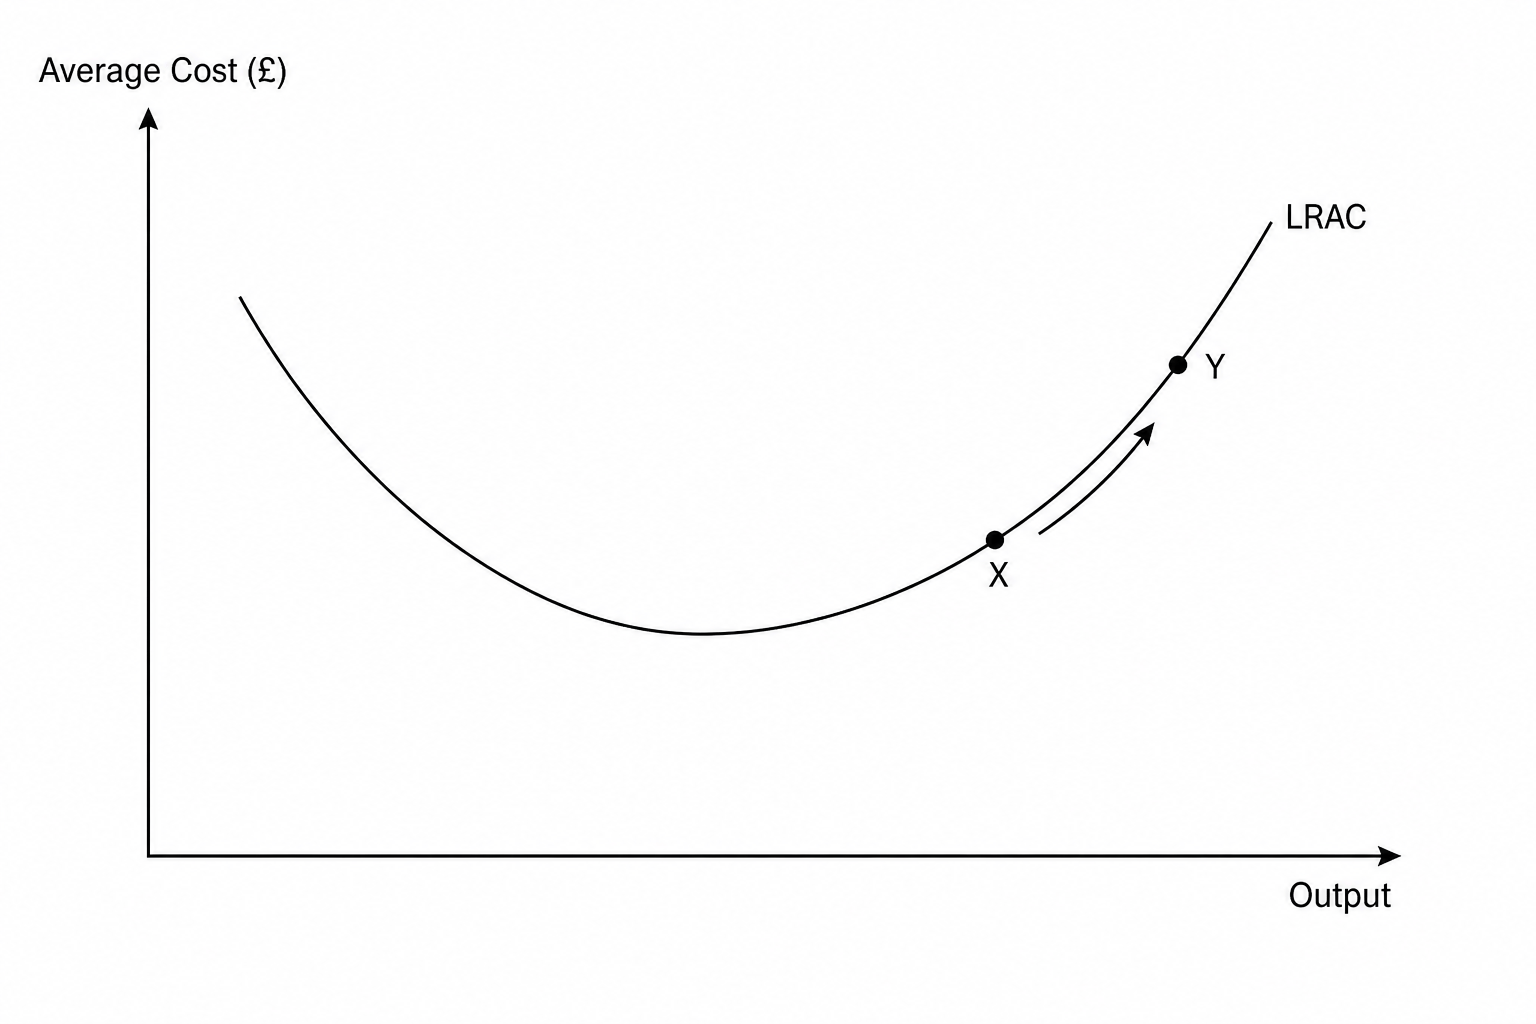
Which of the following is the most likely cause of a movement from X X\,X to Y Y\,Y along the Long-Run Average Cost (LRAC) curve shown in the diagram below?
Congestion on local regional transport infrastructure increases transit delays and delivery costs for all distributors in the industrial zone.
The firm invests in specialized automated production lines that significantly increase labor productivity as output scales up.
The firm struggles with communication breakdowns and coordination delays across its newly expanded multi-layered management hierarchy.
A reduction in the national rate of business rates (property tax) decreases the fixed overhead costs for all manufacturing firms.

