Skip to content
MathsGenie logo
Open app

Course home

  1. A Level
  2. Economics Eduqas
  3. Revision guides

Consumer and producer surplus

What you'll learn

  • What consumer surplus and producer surplus mean in a product market.
  • How to show both types of surplus on a demand and supply diagram.
  • How to calculate surplus using the area of a triangle.
  • Why consumer surplus and producer surplus are jointly maximised at the free market equilibrium.

The key prerequisite: demand and supply as “willingness” curves

Before surplus makes sense, you need to interpret the demand and supply curves carefully.

A demand curve shows the quantity consumers are willing and able to buy at different prices. For surplus analysis, it can also be read as consumers’ maximum willingness to pay for each unit.

A supply curve shows the quantity producers are willing and able to sell at different prices. For surplus analysis, it can also be read as producers’ minimum willingness to accept for each unit, often linked to marginal cost.

Definition

Free market equilibrium

The free market equilibrium is the price and quantity where demand equals supply, with no government intervention. It is shown where the demand and supply curves intersect.

For example, if a consumer would have paid up to £40 for a concert ticket but the market price is £30, they gain £10 of extra benefit. That extra benefit is the foundation of consumer surplus.

Consumer surplus

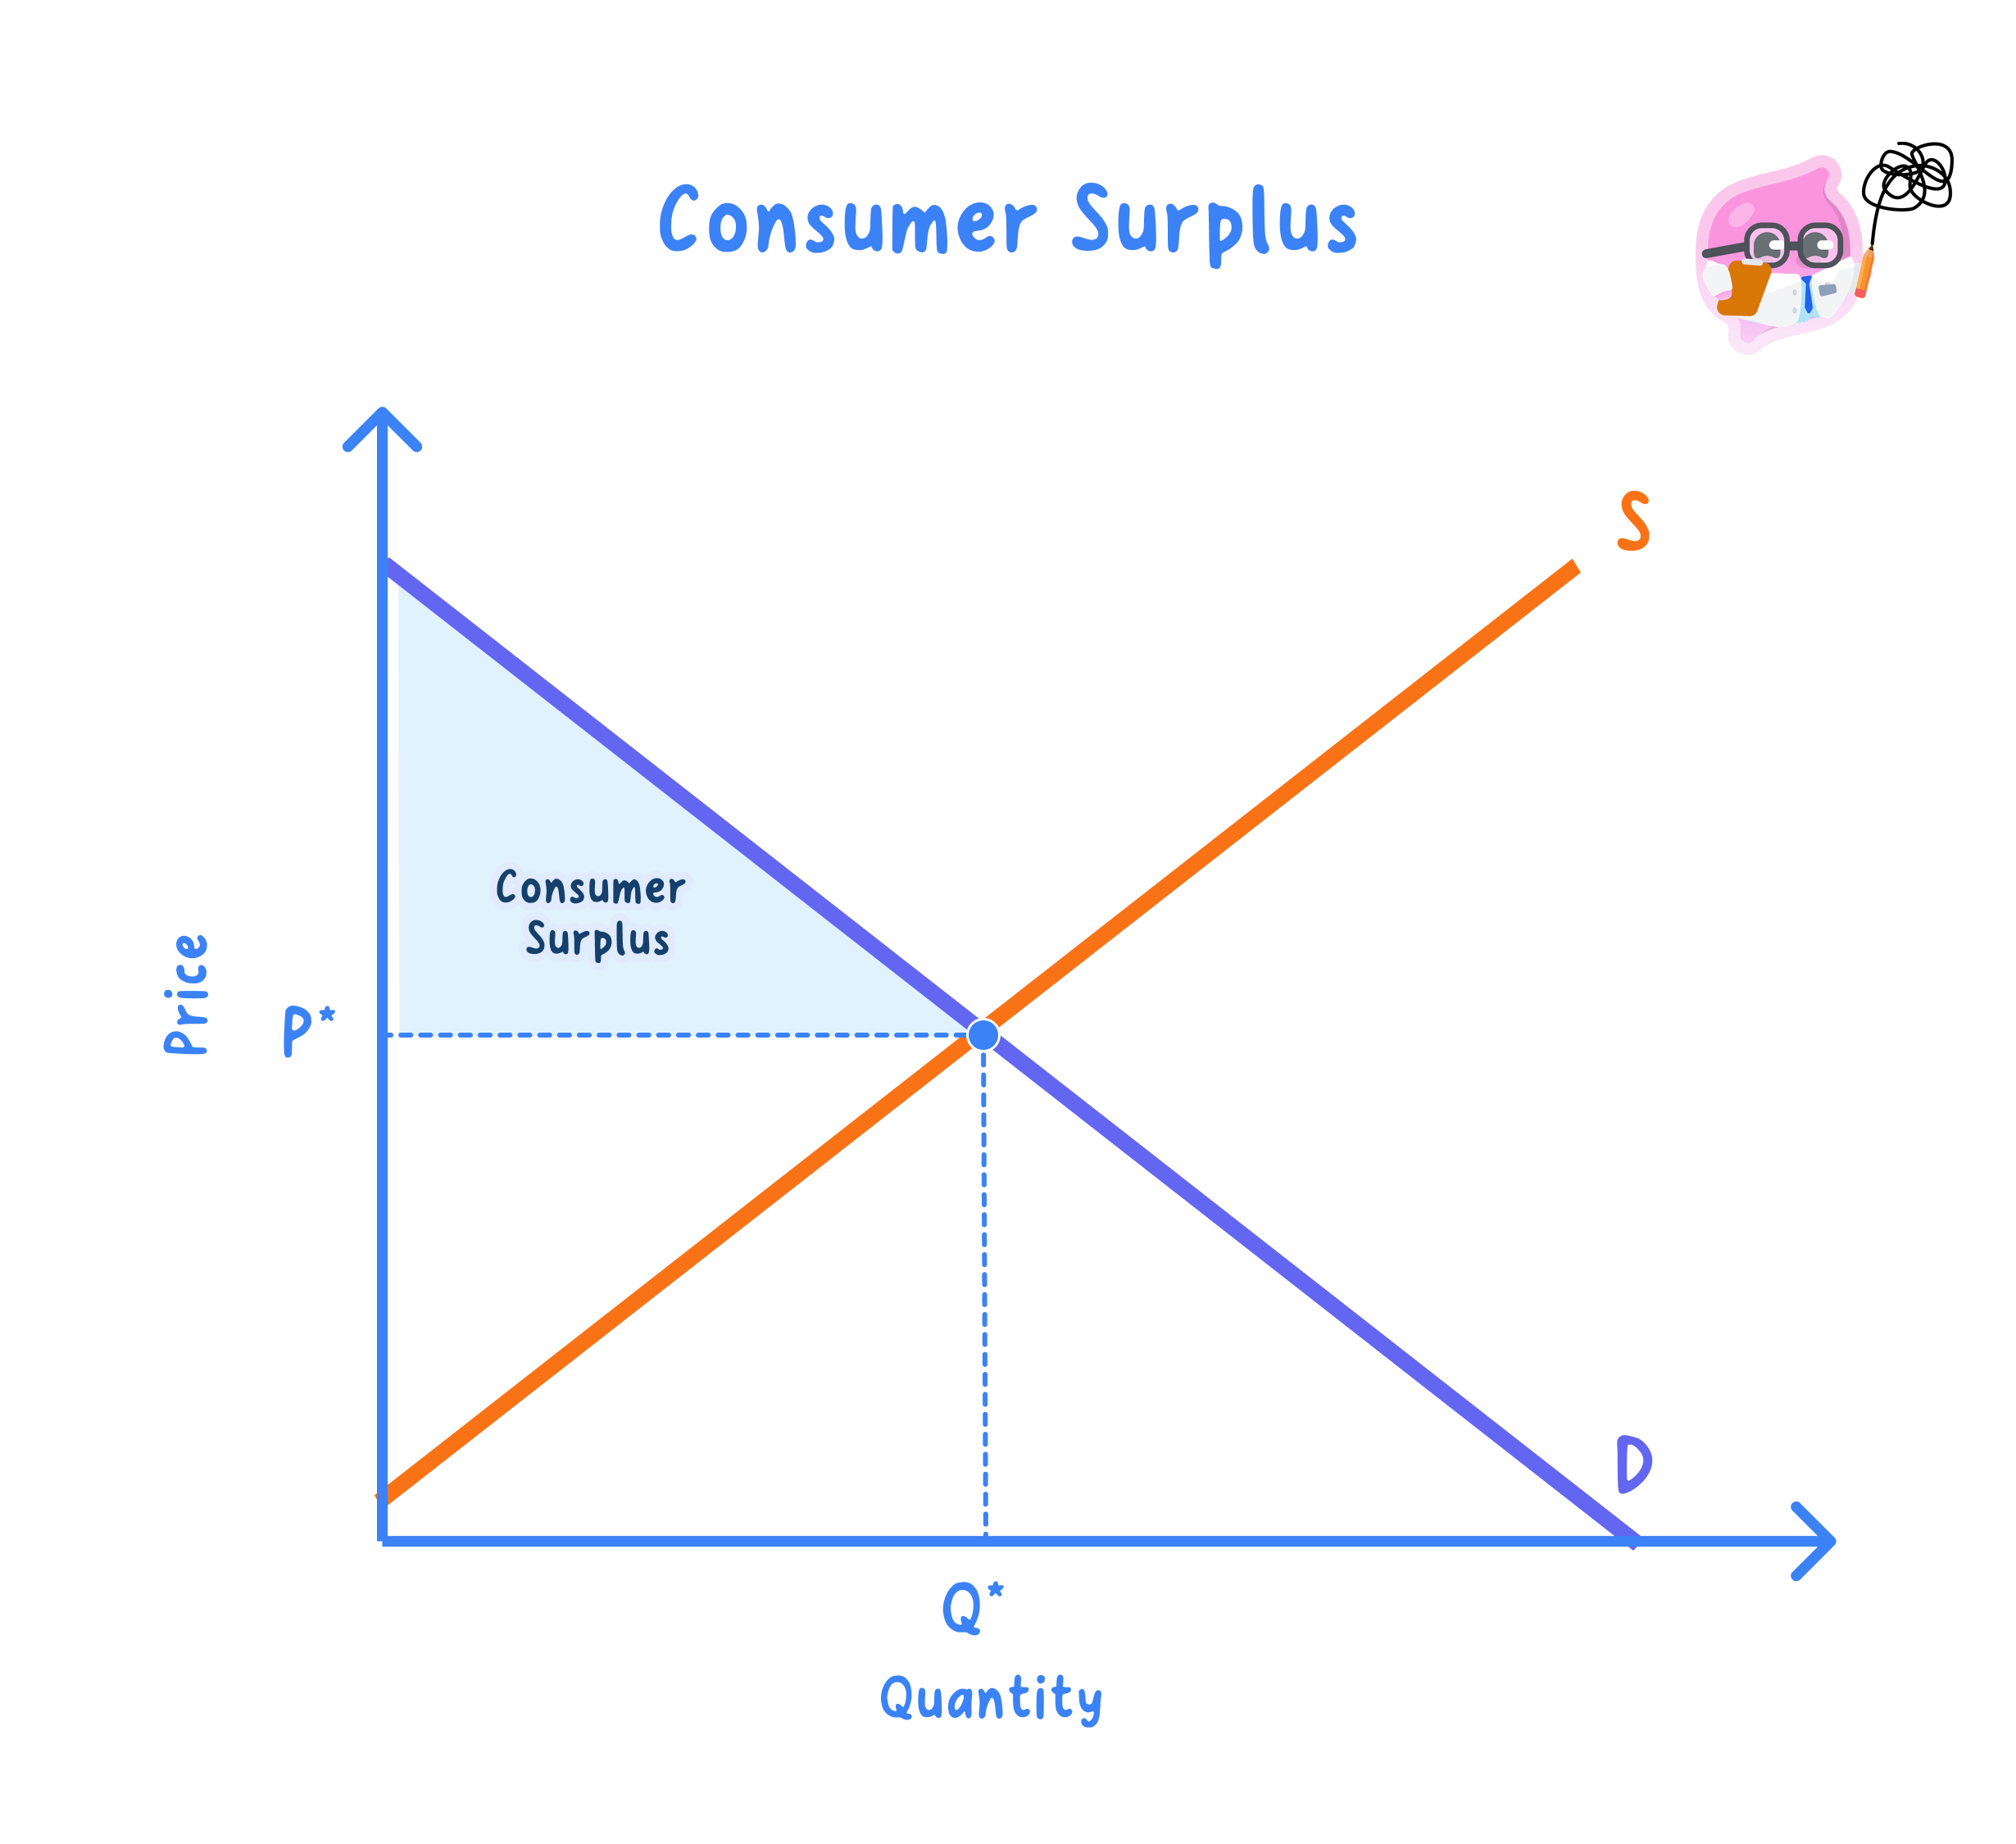
Consumer surplus measures the benefit consumers receive when they pay less than they were willing to pay.

Definition

Consumer surplus

Consumer surplus is the difference between the maximum price consumers are willing to pay and the price they actually pay.

On a diagram, consumer surplus is the area:

  • below the demand curve
  • above the market price
  • up to the quantity traded

That area is usually a triangle in A-Level diagrams because demand curves are often drawn as straight lines.

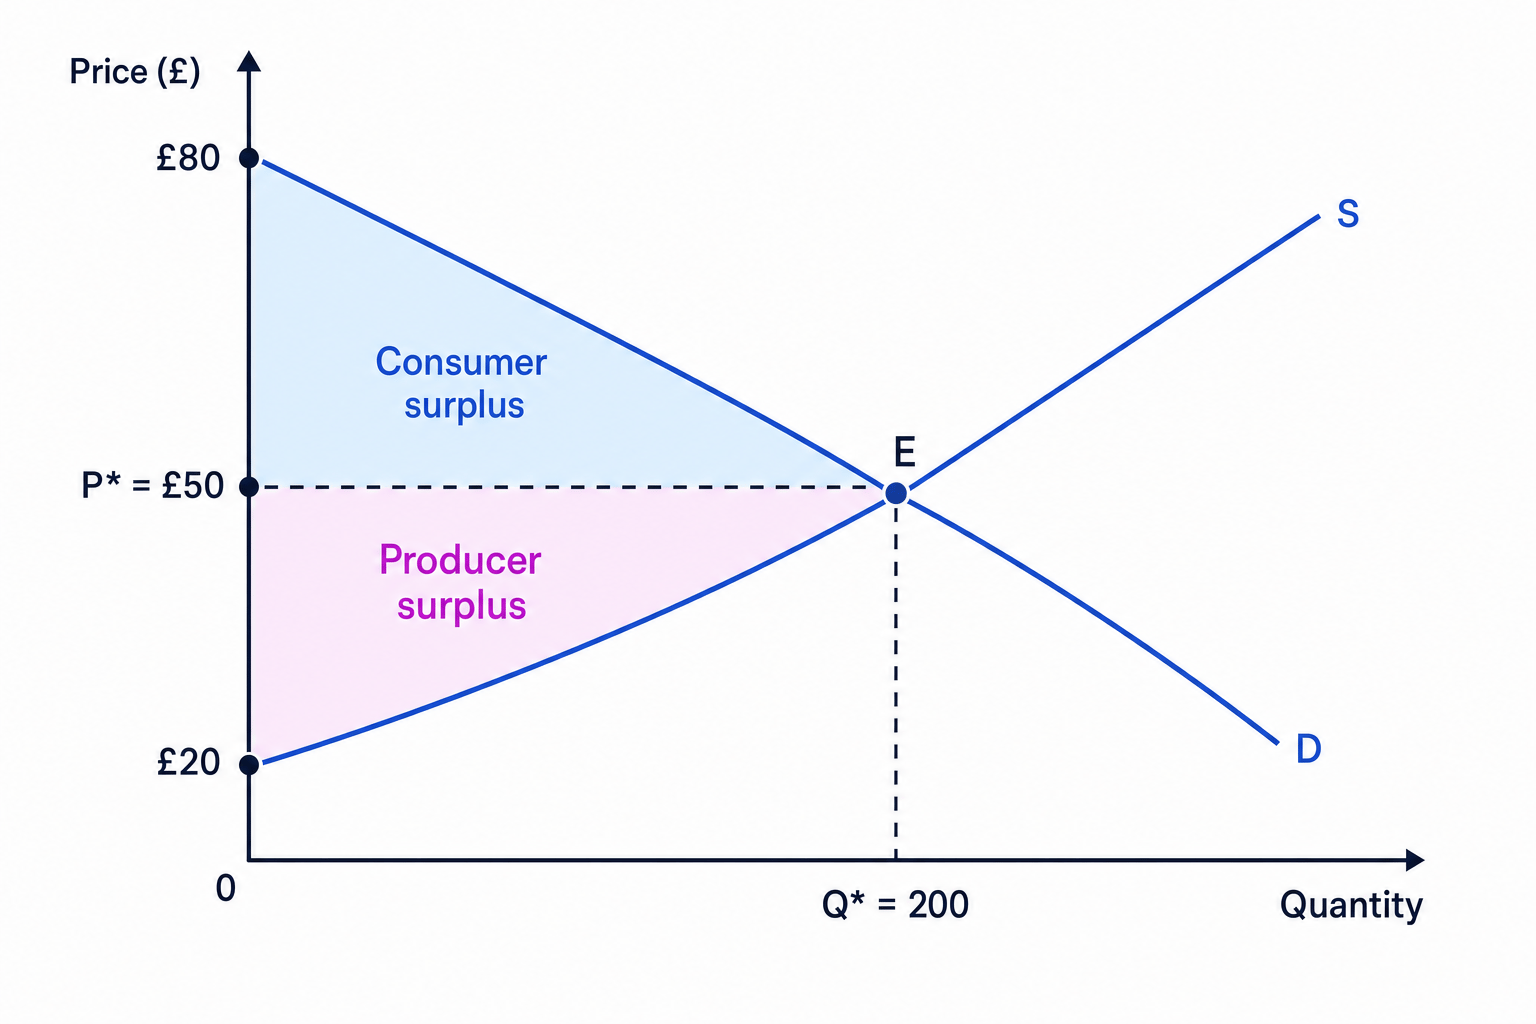
Demand and supply diagram showing consumer surplus, producer surplus and total surplus at free market equilibrium

Key Idea

Reading consumer surplus

The demand curve shows what consumers are willing to pay. The market price shows what they actually pay. The gap between the two is consumer surplus.

Example

Calculating consumer surplus

Suppose the highest price any consumer would pay is £50. The market equilibrium price is £30 and the equilibrium quantity is 100 units.

  1. Identify the height of the consumer surplus triangle: £50 − £30 = £20.

  2. Identify the base of the triangle: 100 units are traded.

  3. Use the triangle area formula:

Consumer surplus=12×base×height \text{Consumer surplus} = \frac{1}{2} \times \text{base} \times \text{height} Consumer surplus=21​×base×height
  1. Substitute the values:
Consumer surplus=12×100×£20=£1,000 \text{Consumer surplus} = \frac{1}{2} \times 100 \times £20 = £1{,}000 Consumer surplus=21​×100×£20=£1,000

So, consumer surplus is £1,000.

Common Mistake

Using total spending instead

Consumer surplus is not total consumer spending. Total spending is price × quantity, so here it would be £30 × 100 = £3,000. Consumer surplus is the extra benefit above what consumers paid.

Producer surplus

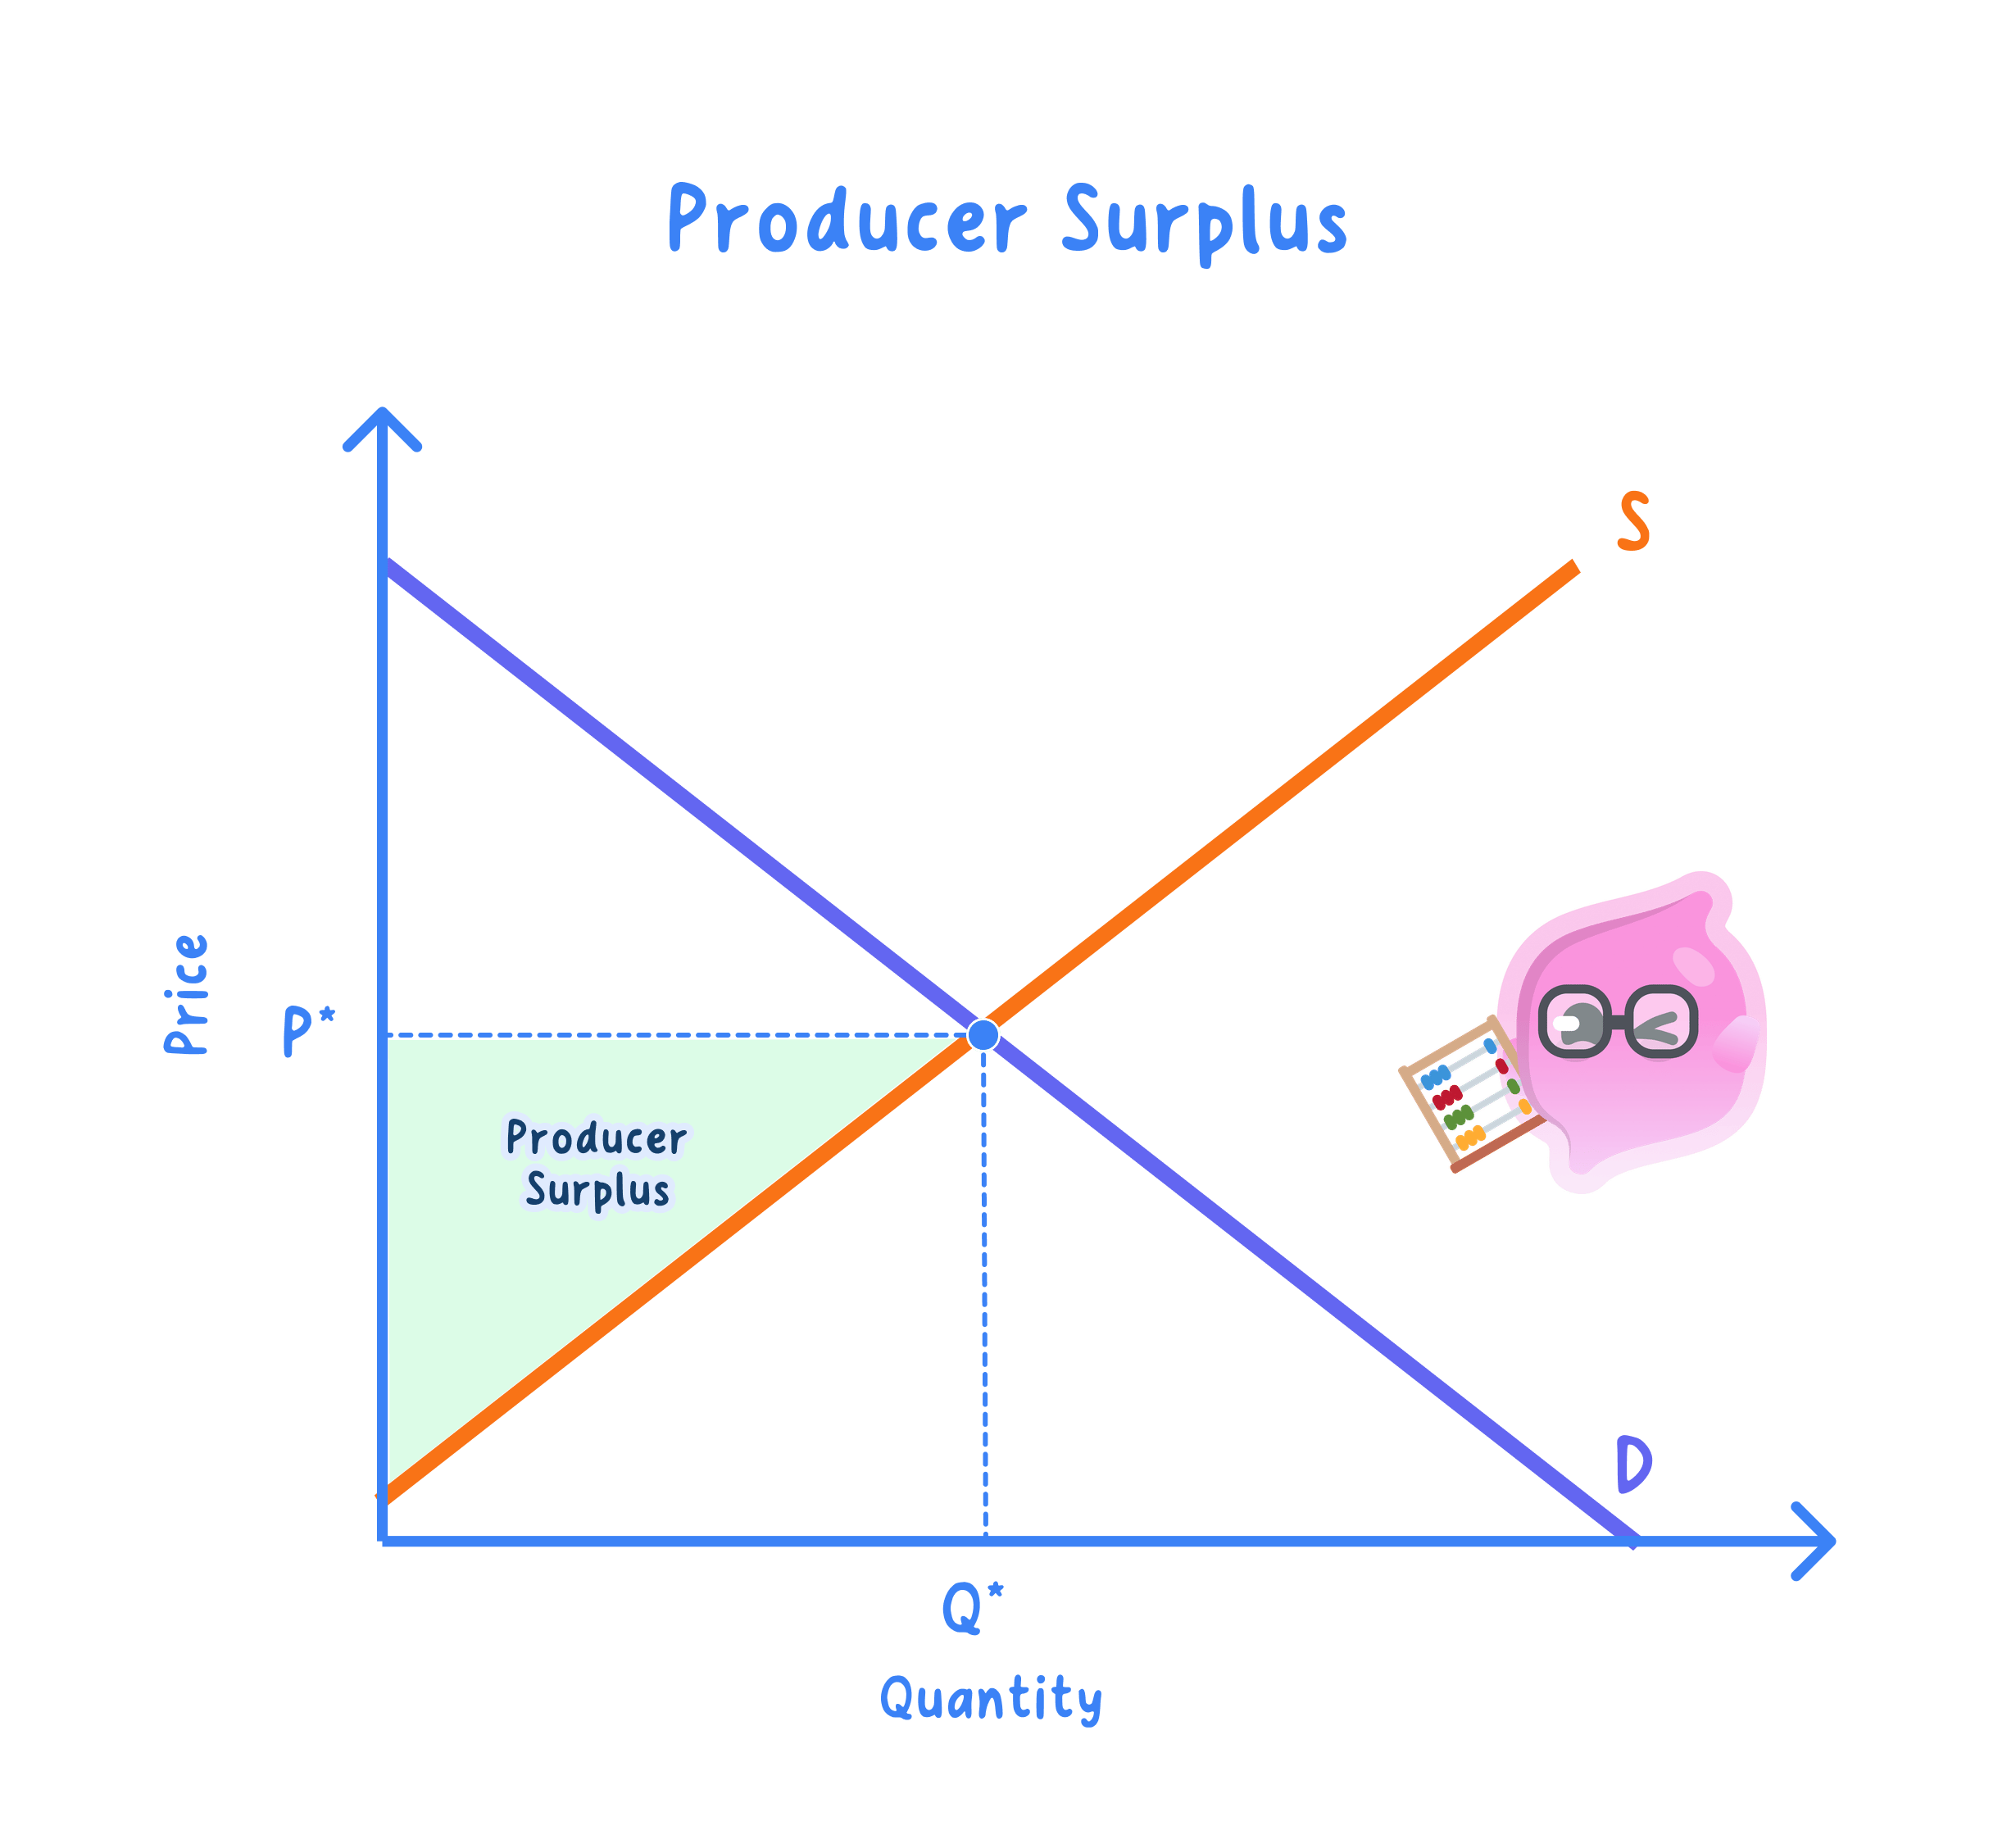
Producer surplus measures the benefit producers receive when they sell for more than the minimum price they would have accepted.

Definition

Producer surplus

Producer surplus is the difference between the price producers actually receive and the minimum price they are willing to accept.

On a diagram, producer surplus is the area:

  • above the supply curve
  • below the market price
  • up to the quantity traded

The supply curve matters because it shows the minimum acceptable price for each unit. For many firms, this relates to the marginal cost, meaning the extra cost of producing one more unit.

Example

Calculating producer surplus

Suppose the supply curve starts at £10, meaning the lowest-cost producers would accept £10. The market equilibrium price is £30 and the equilibrium quantity is 100 units.

  1. Identify the height of the producer surplus triangle: £30 − £10 = £20.

  2. Identify the base of the triangle: 100 units are traded.

  3. Use the triangle area formula:

Producer surplus=12×base×height \text{Producer surplus} = \frac{1}{2} \times \text{base} \times \text{height} Producer surplus=21​×base×height
  1. Substitute the values:
Producer surplus=12×100×£20=£1,000 \text{Producer surplus} = \frac{1}{2} \times 100 \times £20 = £1{,}000 Producer surplus=21​×100×£20=£1,000

So, producer surplus is £1,000.

Tip

Quick diagram check

Consumer surplus is usually the top triangle above the price line. Producer surplus is usually the bottom triangle below the price line.

Total surplus and economic welfare

When economists add consumer surplus and producer surplus together, they get total surplus.

Definition

Total surplus

Total surplus is consumer surplus plus producer surplus. It is a measure of the total welfare gained by consumers and producers from market exchange.

In this topic, welfare means economic well-being or benefit. It does not mean government welfare payments.

If consumer surplus is £1,000 and producer surplus is £1,000, total surplus is £2,000.

Total surplus=Consumer surplus+Producer surplus \text{Total surplus} = \text{Consumer surplus} + \text{Producer surplus} Total surplus=Consumer surplus+Producer surplus

Total surplus is useful because it helps economists judge whether a market outcome creates the largest possible gains from trade.

Why surplus is maximised at free market equilibrium

In a simple competitive market with no market failure, consumer surplus and producer surplus are jointly maximised at the free market equilibrium.

That means the total area of consumer surplus plus producer surplus is as large as possible at the equilibrium quantity.

Key Idea

Why equilibrium maximises total surplus

At the equilibrium quantity, every unit where consumer benefit is greater than producer cost is produced, and no unit where producer cost is greater than consumer benefit is produced.

To see the logic:

  • For quantities below equilibrium, demand lies above supply. Consumers’ willingness to pay is greater than producers’ willingness to accept. Extra units would create additional welfare.
  • At the equilibrium, willingness to pay equals willingness to accept for the final unit.
  • For quantities above equilibrium, supply lies above demand. Producers’ cost is greater than consumers’ benefit. Extra units would reduce welfare.

This is why economists often say the free market equilibrium is allocatively efficient, assuming there are no externalities, information failures or other distortions.

Definition

Allocative efficiency

Allocative efficiency occurs when resources are distributed to maximise total welfare, so the marginal benefit to consumers equals the marginal cost to producers.

Example

Showing why equilibrium maximises welfare

Suppose the equilibrium quantity is 100 units. At 80 units, consumers are willing to pay £36 for the next unit, while producers are willing to accept £24.

  1. Compare the marginal benefit and marginal cost: £36 is greater than £24.

  2. Calculate the extra welfare from producing that unit: £36 − £24 = £12.

  3. Conclude that producing more units increases total surplus because the benefit to consumers exceeds the cost to producers.

Now suppose output rises beyond equilibrium. At 120 units, consumers are willing to pay £22, while producers need £34.

  1. Compare the marginal benefit and marginal cost: £22 is less than £34.

  2. Calculate the welfare loss from that extra unit: £34 − £22 = £12.

  3. Conclude that producing this unit reduces total surplus because the cost to producers exceeds the benefit to consumers.

Common Mistake

Only under certain assumptions

The claim that free market equilibrium maximises welfare assumes no externalities, no monopoly power, good information and competitive markets. For example, if petrol consumption creates pollution costs not included in the market price, the free market quantity may be too high.

How to calculate surplus from a diagram

Most Eduqas questions give you a labelled diagram with prices and quantities. If the surplus area is triangular, use:

Area of triangle=12×base×height \text{Area of triangle} = \frac{1}{2} \times \text{base} \times \text{height} Area of triangle=21​×base×height

The base is normally the equilibrium quantity. The height is the vertical price gap.

For consumer surplus:

Height=maximum willingness to pay−market price \text{Height} = \text{maximum willingness to pay} - \text{market price} Height=maximum willingness to pay−market price

For producer surplus:

Height=market price−minimum willingness to accept \text{Height} = \text{market price} - \text{minimum willingness to accept} Height=market price−minimum willingness to accept
Example

Calculating consumer, producer and total surplus

A market has the following diagram values:

  • Demand intercept: £80
  • Supply intercept: £20
  • Equilibrium price: £50
  • Equilibrium quantity: 200 units
  1. Calculate consumer surplus height: £80 − £50 = £30.

  2. Calculate consumer surplus:

Consumer surplus=12×200×£30=£3,000 \text{Consumer surplus} = \frac{1}{2} \times 200 \times £30 = £3{,}000 Consumer surplus=21​×200×£30=£3,000
  1. Calculate producer surplus height: £50 − £20 = £30.

  2. Calculate producer surplus:

Producer surplus=12×200×£30=£3,000 \text{Producer surplus} = \frac{1}{2} \times 200 \times £30 = £3{,}000 Producer surplus=21​×200×£30=£3,000
  1. Add them together:
Total surplus=£3,000+£3,000=£6,000 \text{Total surplus} = £3{,}000 + £3{,}000 = £6{,}000 Total surplus=£3,000+£3,000=£6,000

So, consumer surplus is £3,000, producer surplus is £3,000, and total surplus is £6,000.

Common Mistake

Forgetting the half

Because surplus is often a triangle, you must multiply by one half. If you calculate base × height, you have accidentally calculated a rectangle, not the surplus triangle.

Applying the idea to real markets

Surplus helps explain why consumers and producers both benefit from voluntary exchange.

For example, in the UK supermarket market, a shopper may be willing to pay £2.50 for a loaf of bread but only pays £1.60. That shopper receives consumer surplus. The supermarket may have been willing to supply it for at least £1.20, so receiving £1.60 gives producer surplus.

During the recent UK cost-of-living squeeze, higher food and energy prices reduced consumer surplus for many households. If prices rise while willingness to pay does not rise by as much, the gap between what consumers would pay and what they actually pay becomes smaller.

However, producer surplus may rise or fall depending on costs. If energy and labour costs rise sharply, firms may receive higher prices but still not gain much producer surplus because their minimum acceptable price has also increased.

Tip

Good AO2 application

When applying surplus, mention a specific market: UK rental housing, petrol, rail travel, supermarket food, energy bills or concert tickets. Then explain how a change in price affects the gap between willingness to pay and actual price.

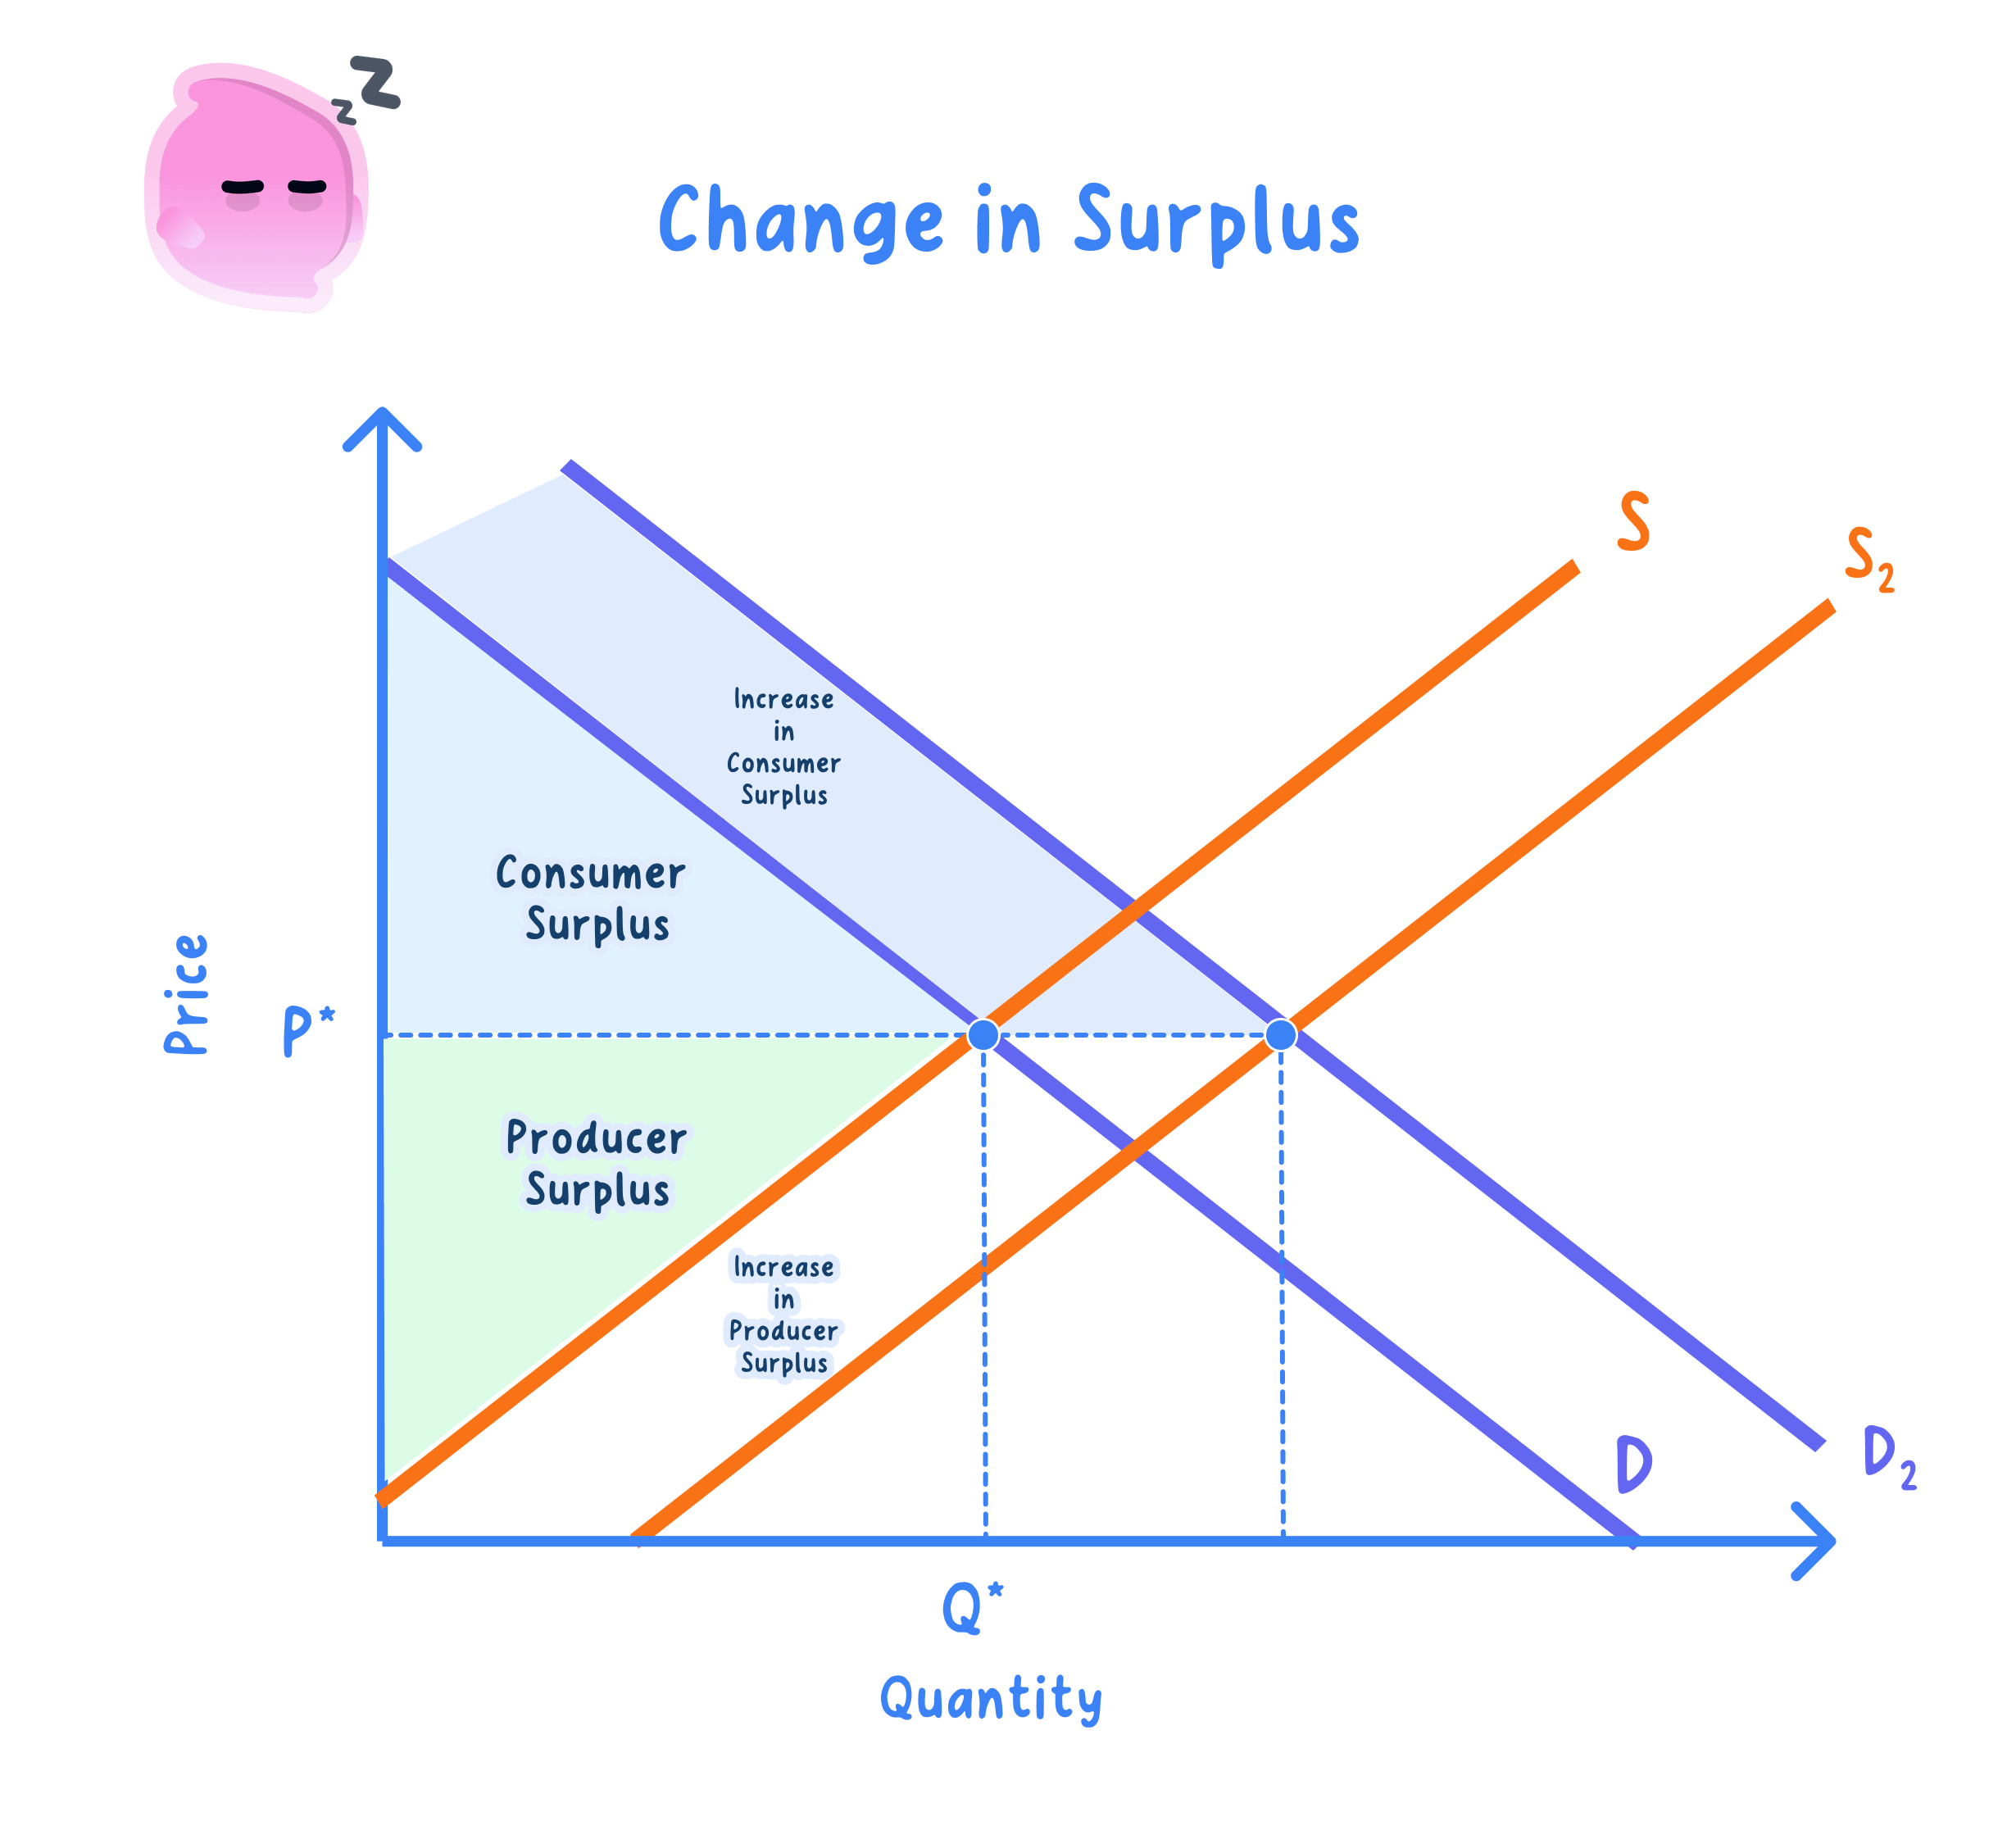
Surplus and changes in price

If the market price rises, consumer surplus usually falls because consumers are paying closer to their maximum willingness to pay. Some consumers may leave the market altogether.

Producer surplus usually rises when price rises, because firms receive more above their minimum acceptable price. But this depends on whether costs have also changed.

If the market price falls, consumer surplus usually rises, while producer surplus usually falls.

Key Idea

Distribution versus total welfare

A price change can redistribute surplus between consumers and producers. But the free market equilibrium matters because it maximises the combined total surplus in a simple competitive market.

For essays, this distinction is powerful. A policy may help consumers but harm producers, or vice versa. The best answers separate who gains, who loses, and whether total welfare rises or falls.

Exam technique

In the exam

  1. Start by defining consumer surplus or producer surplus precisely, using “willingness to pay” or “willingness to accept”.

  2. On diagrams, label axes, equilibrium price, equilibrium quantity, consumer surplus and producer surplus clearly.

  3. For calculations, identify the base and height first, then use the triangle formula and include £ units in your final answer.

  4. For analysis, explain that total surplus is maximised at the free market equilibrium only if there is no market failure.

Self review

Check yourself

  • Why is consumer surplus shown below the demand curve but above the market price?
  • A diagram has a demand intercept of £60, equilibrium price of £40 and equilibrium quantity of 50 units. What is consumer surplus?
  • Why might a free market equilibrium fail to maximise welfare in a market such as petrol or cigarettes?
Recap questions

1 of 5

A buyer can choose how many units to buy and values the first three units of a good at £9, £7 and £4. The market price is £6 per unit. What is their total consumer surplus?

PreviousNext

How was this guide?

Teach Genie

Review Consumer and producer surplus by teaching Genie

Teach it back in your own words, spot gaps, and remember it better.

Start teaching
Genie and Baby Genie

Lesson

Recap your knowledge with an interactive lesson

7 minute activity

Start lesson

Demand and supply diagram with equilibrium at £50 and 200 units, showing consumer surplus above the price line and producer surplus below it

A demand curve can be read as consumers' maximum willingness to pay for each unit. A supply curve can be read as producers' minimum willingness to accept, often linked to marginal cost.

At the free market equilibrium, demand equals supply at price P∗P^{*}P∗ and quantity Q∗Q^{*}Q∗. Consumer surplus is the area below demand but above the market price, while producer surplus is the area above supply but below the market price.

The two shaded triangles represent gains from trade. Together they form total surplus, which economists use as a simple measure of welfare in a competitive market.

Flashcards

Remember key concepts with flashcards

24 flashcards

Practice flashcards

In surplus analysis, what does the demand curve show for each unit?

Consumer and producer surplus Revision Guide

  1. A Level
  2. /Economics
  3. /Consumer and producer surplus