What you'll learn
- How demand and supply determine the market price and quantity traded.
- Why shortages and surpluses create pressure for prices to change.
- The difference between a movement along a curve and a shift of a curve.
- How to explain the effects of demand and supply shifts on price and output.
The market setting
A product market is a market where goods or services are bought and sold, such as the market for bread, smartphones, haircuts or train tickets.
In this topic, output means the quantity of the product traded in the market, not national output or GDP.
Freely competitive market
A freely competitive market is a market with many buyers and sellers, where no single participant can control the market price, and price and output are determined mainly by demand and supply rather than by government controls.
This is the basic market model behind much of microeconomics. Real markets are often not perfectly competitive, but the demand and supply model is still a powerful starting point.
Demand and supply: the prerequisites
Demand
Demand is the quantity of a good or service that consumers are willing and able to buy at different prices over a given period of time.
The demand curve usually slopes downwards. This shows that, ceteris paribus — meaning “all other things being equal” — as price falls, quantity demanded tends to rise.
Reasons include:
- the good becomes more affordable;
- consumers switch away from now relatively more expensive substitutes;
- existing consumers may buy more.
Supply
Supply is the quantity of a good or service that producers are willing and able to sell at different prices over a given period of time.
The supply curve usually slopes upwards. This shows that, ceteris paribus, as price rises, quantity supplied tends to rise.
Reasons include:
- higher prices create a profit incentive to produce more;
- firms may cover the higher marginal costs of extra output;
- new firms may be attracted into the market over time.
Curves show relationships, not events
A demand or supply curve shows how quantity changes when the product’s own price changes, assuming other factors stay constant.
Movements along curves versus shifts of curves
This distinction is essential for Eduqas diagrams.
A movement along the demand curve happens only when the product’s own price changes. For example, if the price of apples falls, consumers buy more apples: that is an extension of demand.
A shift of the demand curve happens when a non-price factor changes demand at every price. For example, a health campaign encouraging fruit consumption could shift the demand curve for apples to the right.
Demand may shift because of changes in:
- income;
- tastes and fashion;
- advertising;
- population size or demographics;
- the price of substitutes, such as tea and coffee;
- the price of complements, such as printers and ink cartridges;
- expectations about future prices.
Supply may shift because of changes in:
- costs of production, such as wages, energy or raw materials;
- technology and productivity;
- indirect taxes or subsidies;
- weather conditions;
- the number of firms in the market;
- regulations.
Classifying movements and shifts
-
If the price of strawberries falls from £3 to £2 per punnet and consumers buy more, the cause is the product’s own price, so this is a movement along the demand curve.
-
If a heatwave makes strawberries more popular at every possible price, the cause is a change in preferences, so the demand curve shifts right.
-
If fertiliser and energy costs rise for strawberry farms, production becomes more expensive at every output level, so the supply curve shifts left.
Turning every change into a shift
Do not shift a demand or supply curve just because quantity changes. If the product’s own price changes, it is a movement along the curve, not a shift of the curve.
Market equilibrium
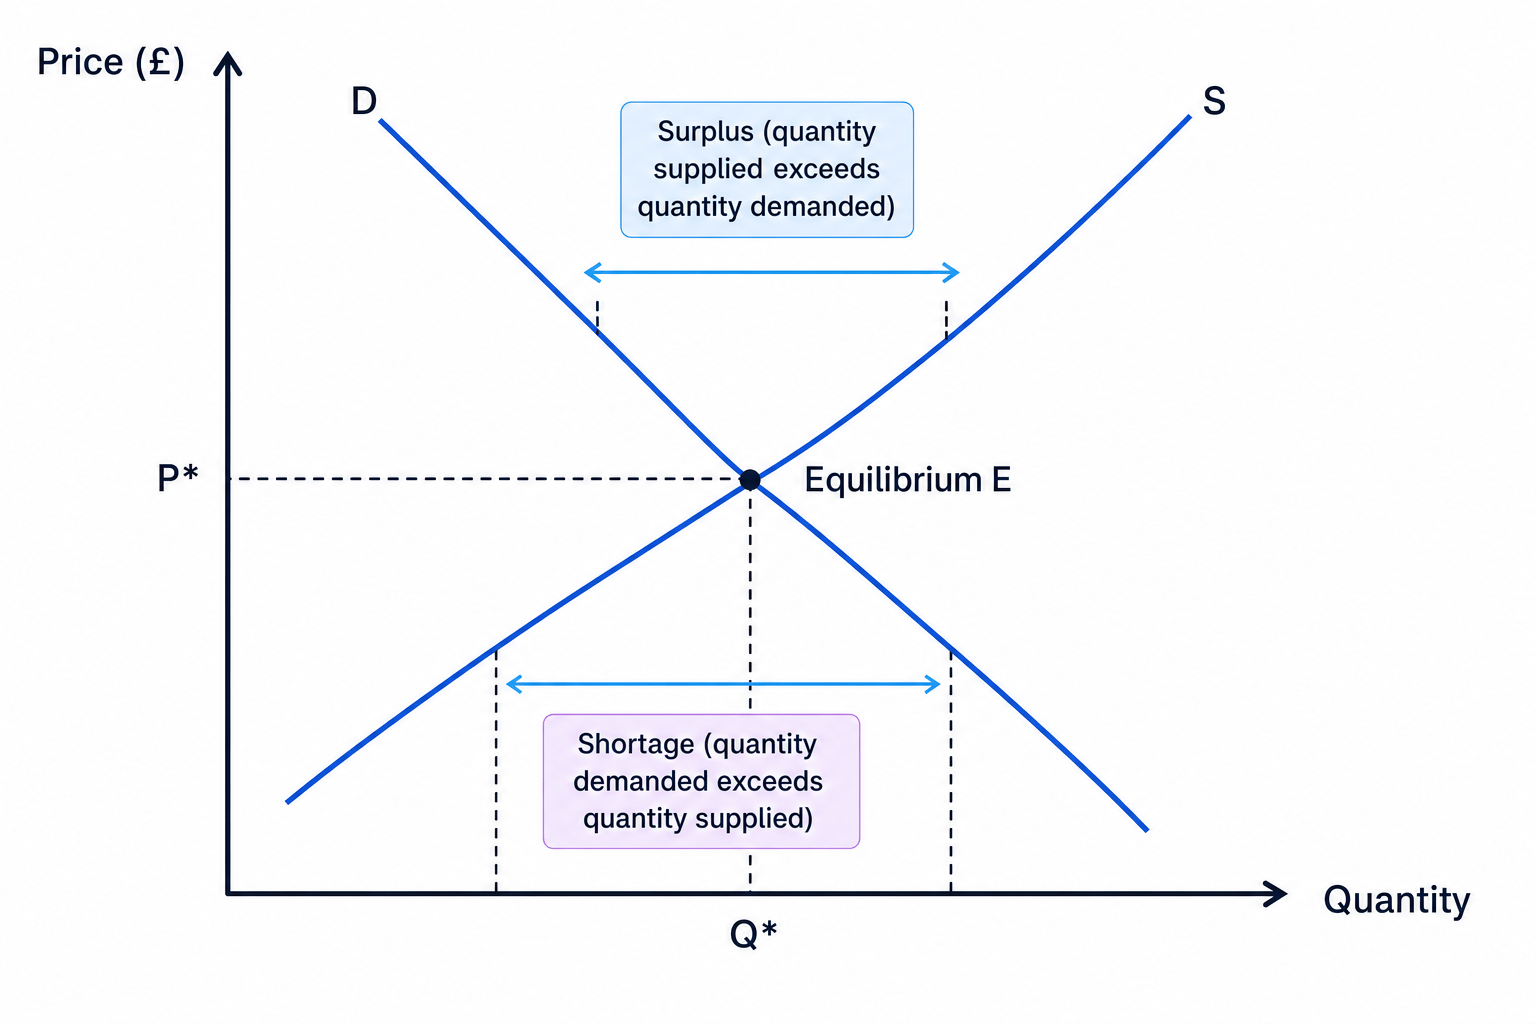
Equilibrium means a position of balance. In a product market, equilibrium occurs where quantity demanded equals quantity supplied.
Equilibrium price and quantity
The equilibrium price is the price at which quantity demanded equals quantity supplied. The equilibrium quantity is the quantity bought and sold at that price.
At equilibrium, there is no automatic pressure for price to change. Buyers wanting to buy at that price are matched by sellers wanting to sell at that price.
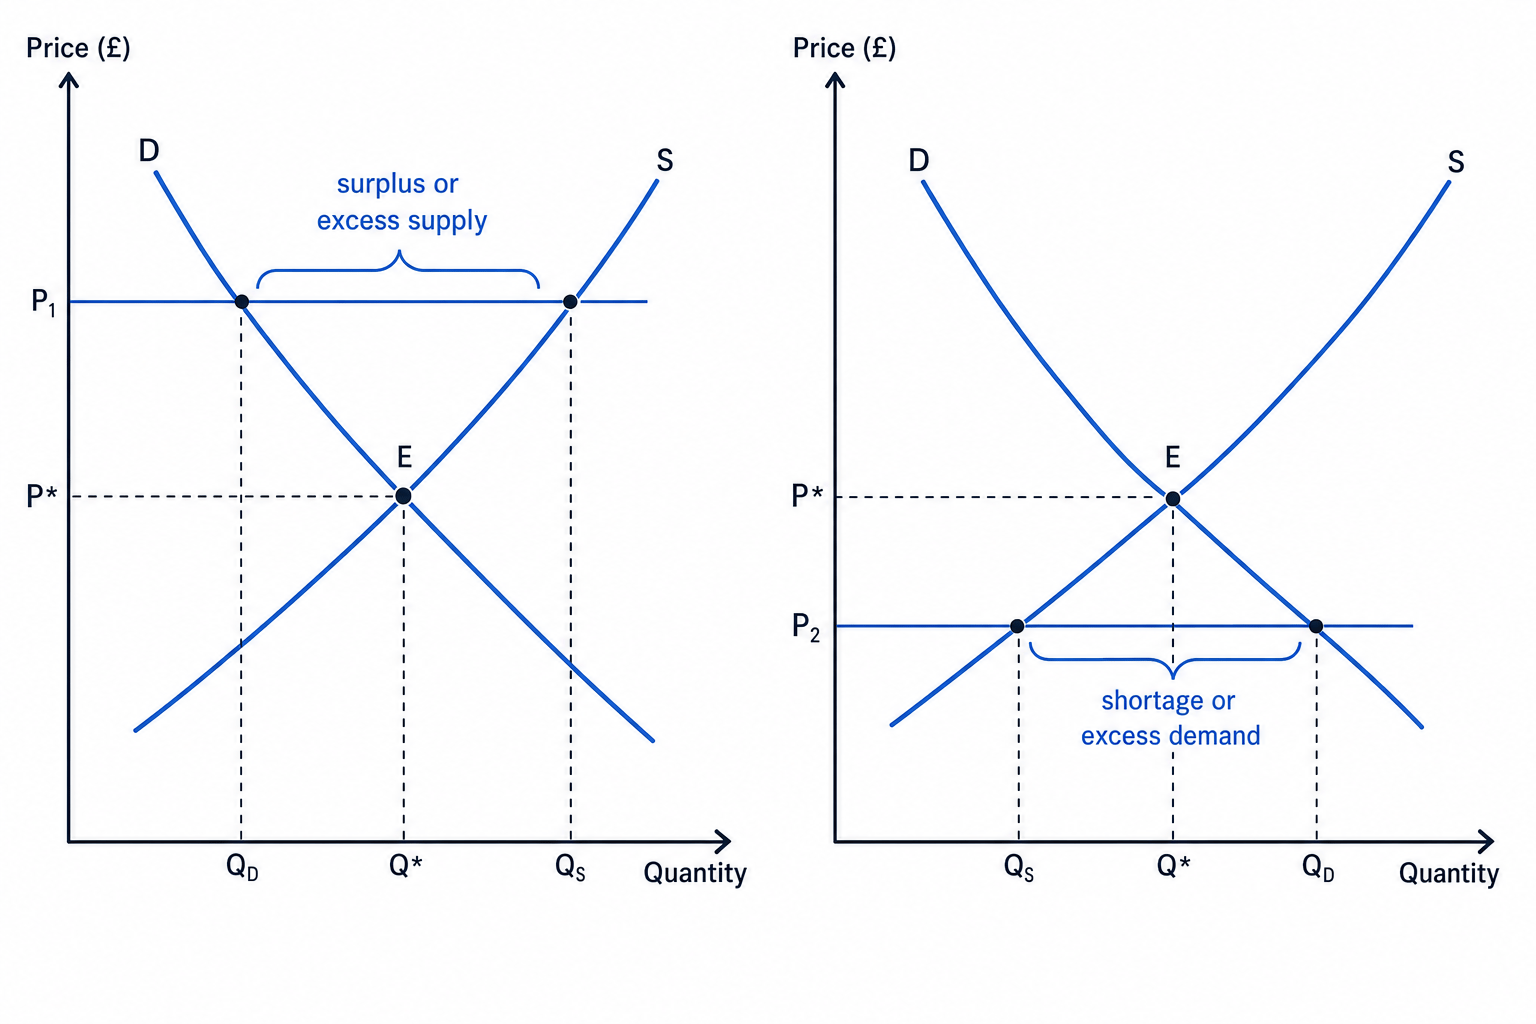
The diagram below shows the core equilibrium position, plus what happens if price is too high or too low.
Surplus and shortage
If the market price is above equilibrium, quantity supplied exceeds quantity demanded. This creates excess supply, also called a surplus. Firms may cut prices to clear unsold stock.
If the market price is below equilibrium, quantity demanded exceeds quantity supplied. This creates excess demand, also called a shortage. Buyers may compete for limited goods, putting upward pressure on price.
Finding equilibrium from equations
Suppose the market demand and supply equations for a product are:
Qd=900−100PQs=100+100P\begin{aligned} Q_d &= 900 - 100P \\ Q_s &= 100 + 100P \end{aligned}QdQs=900−100P=100+100Pwhere PPP is price in £ and quantity is units per day.
- Set quantity demanded equal to quantity supplied because equilibrium requires Qd=QsQ_d = Q_sQd=Qs:
- Solve for the equilibrium price:
So the equilibrium price is £4.
- Substitute P=4P = 4P=4 into either equation to find equilibrium quantity:
So the equilibrium quantity is 500 units per day.
- If the price were £3, then quantity demanded would be 600 and quantity supplied would be 400, creating a shortage of 200 units per day. This would put upward pressure on price.
Shifts in demand
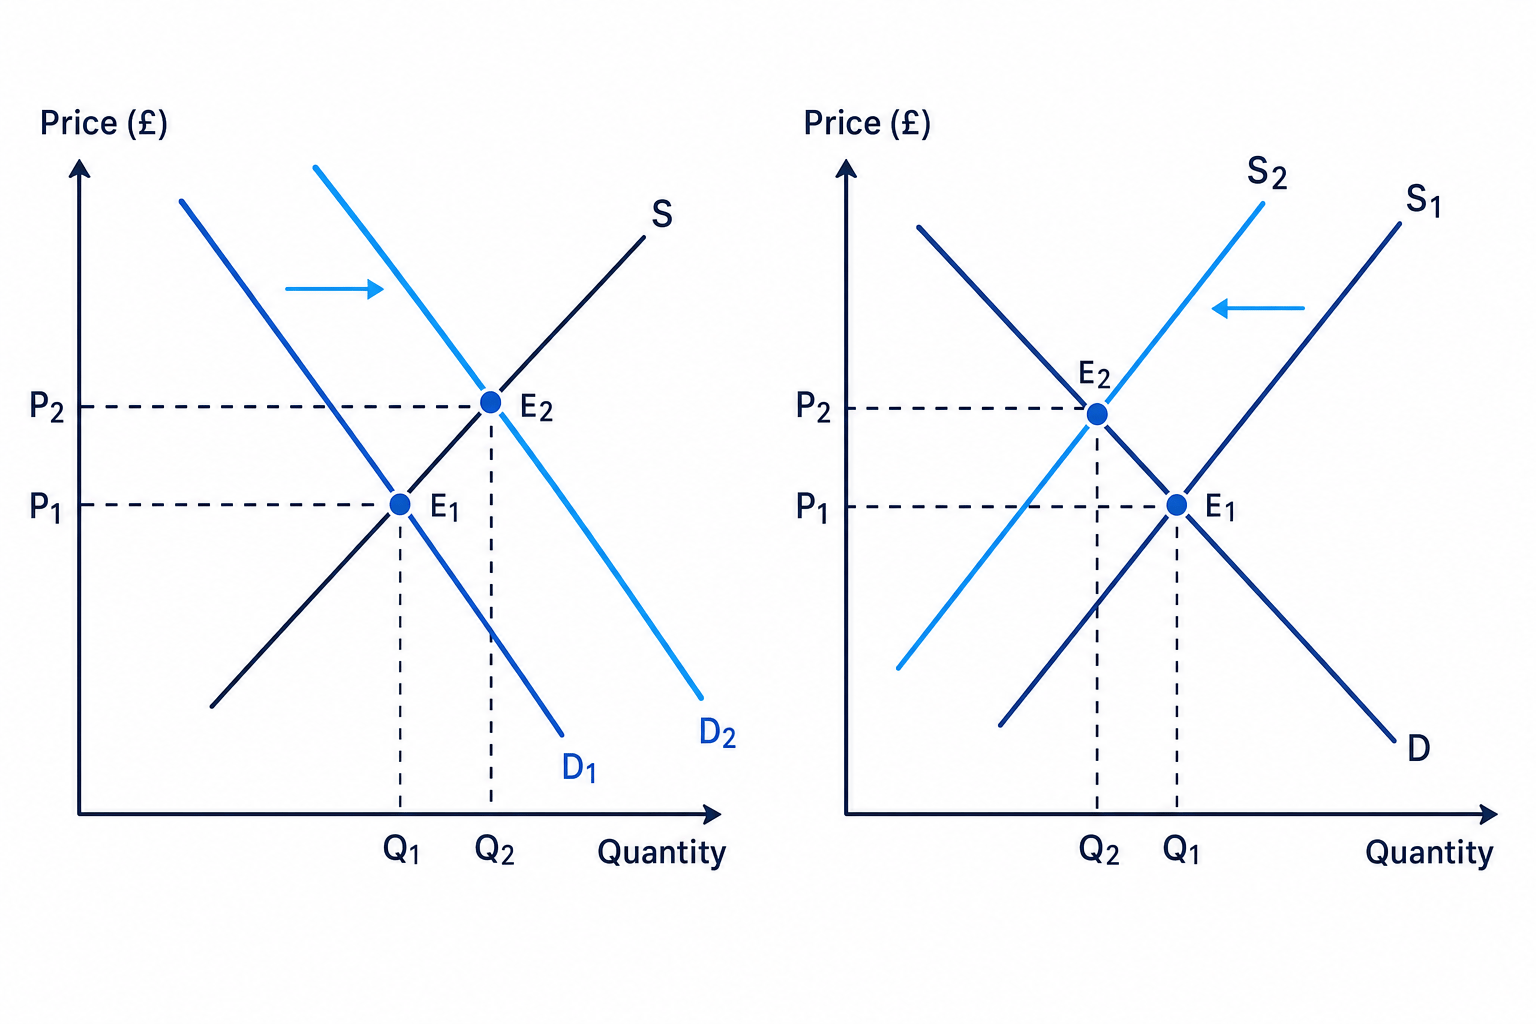
A rightward shift of demand means consumers want to buy more at every price. This causes:
- equilibrium price to rise;
- equilibrium quantity to rise.
Examples include higher consumer incomes for a normal good, successful advertising, or a rise in the price of a substitute.
A leftward shift of demand means consumers want to buy less at every price. This causes:
- equilibrium price to fall;
- equilibrium quantity to fall.
For example, during a cost-of-living squeeze, demand for some non-essential goods may fall as households cut discretionary spending.
Shifts in supply
A rightward shift of supply means firms are willing and able to sell more at every price. This causes:
- equilibrium price to fall;
- equilibrium quantity to rise.
This could happen because of better technology, lower energy costs, or a subsidy.
A leftward shift of supply means firms are willing and able to sell less at every price. This causes:
- equilibrium price to rise;
- equilibrium quantity to fall.
This happened in many markets during global supply-chain disruption and energy price rises, where higher production and transport costs reduced supply.
The diagram below shows two common shift outcomes: increased demand and decreased supply.
Calculating a new equilibrium after a supply decrease
Using the original demand equation:
Qd=900−100PQ_d = 900 - 100PQd=900−100PSuppose higher production costs shift supply left, so the new supply equation is:
Qs=−100+100PQ_s = -100 + 100PQs=−100+100P- Set the new supply equation equal to demand:
- Solve for the new equilibrium price:
So the new equilibrium price is £5.
- Substitute P=5P = 5P=5 into demand:
So the new equilibrium quantity is 400 units per day.
- Compare this with the original equilibrium of £4 and 500 units. The supply decrease has raised price by £1 and reduced output by 100 units per day.
Remember the direction of effects
Demand shifts move price and quantity in the same direction. Supply shifts move price and quantity in opposite directions.
When both demand and supply shift
Sometimes both curves shift at once. For example, demand for electric cars may rise because of changing preferences, while supply also rises because battery technology improves.
In these cases, one outcome may be certain while the other is uncertain:
- Demand rises and supply rises: quantity rises, price is uncertain.
- Demand falls and supply falls: quantity falls, price is uncertain.
- Demand rises and supply falls: price rises, quantity is uncertain.
- Demand falls and supply rises: price falls, quantity is uncertain.
Ambiguous outcomes
When both curves shift, you cannot always state the effect on both price and quantity unless you know the relative size of the shifts. Draw the diagram carefully and explain what the result depends on.
How the price mechanism restores equilibrium
The price mechanism is the system through which prices act as signals and incentives.
If there is a shortage, rising prices signal scarcity. Consumers are encouraged to reduce quantity demanded, while firms are encouraged to increase quantity supplied. The market moves back towards equilibrium.
If there is a surplus, falling prices signal excess availability. Consumers are encouraged to buy more, while firms reduce quantity supplied. Again, the market moves towards equilibrium.
This is why competitive markets are often described as self-correcting, although in real life the adjustment may be slow or imperfect.
In the exam
-
Always label axes as Price (£) and Quantity, then label curves as D and S, and mark the equilibrium price and quantity clearly.
-
For a shift question, identify the cause first: if it is a non-price factor, shift the correct curve; if it is the product’s own price, show a movement along the curve.
-
Explain the chain of reasoning: shift → shortage or surplus at the old price → pressure on price → new equilibrium price and output.
Check yourself
- What is the difference between excess demand and excess supply?
- Why does an increase in demand raise both equilibrium price and quantity?
- If production costs rise, which curve shifts, in which direction, and what happens to price and output?