Reading the diagram
Reading the diagram
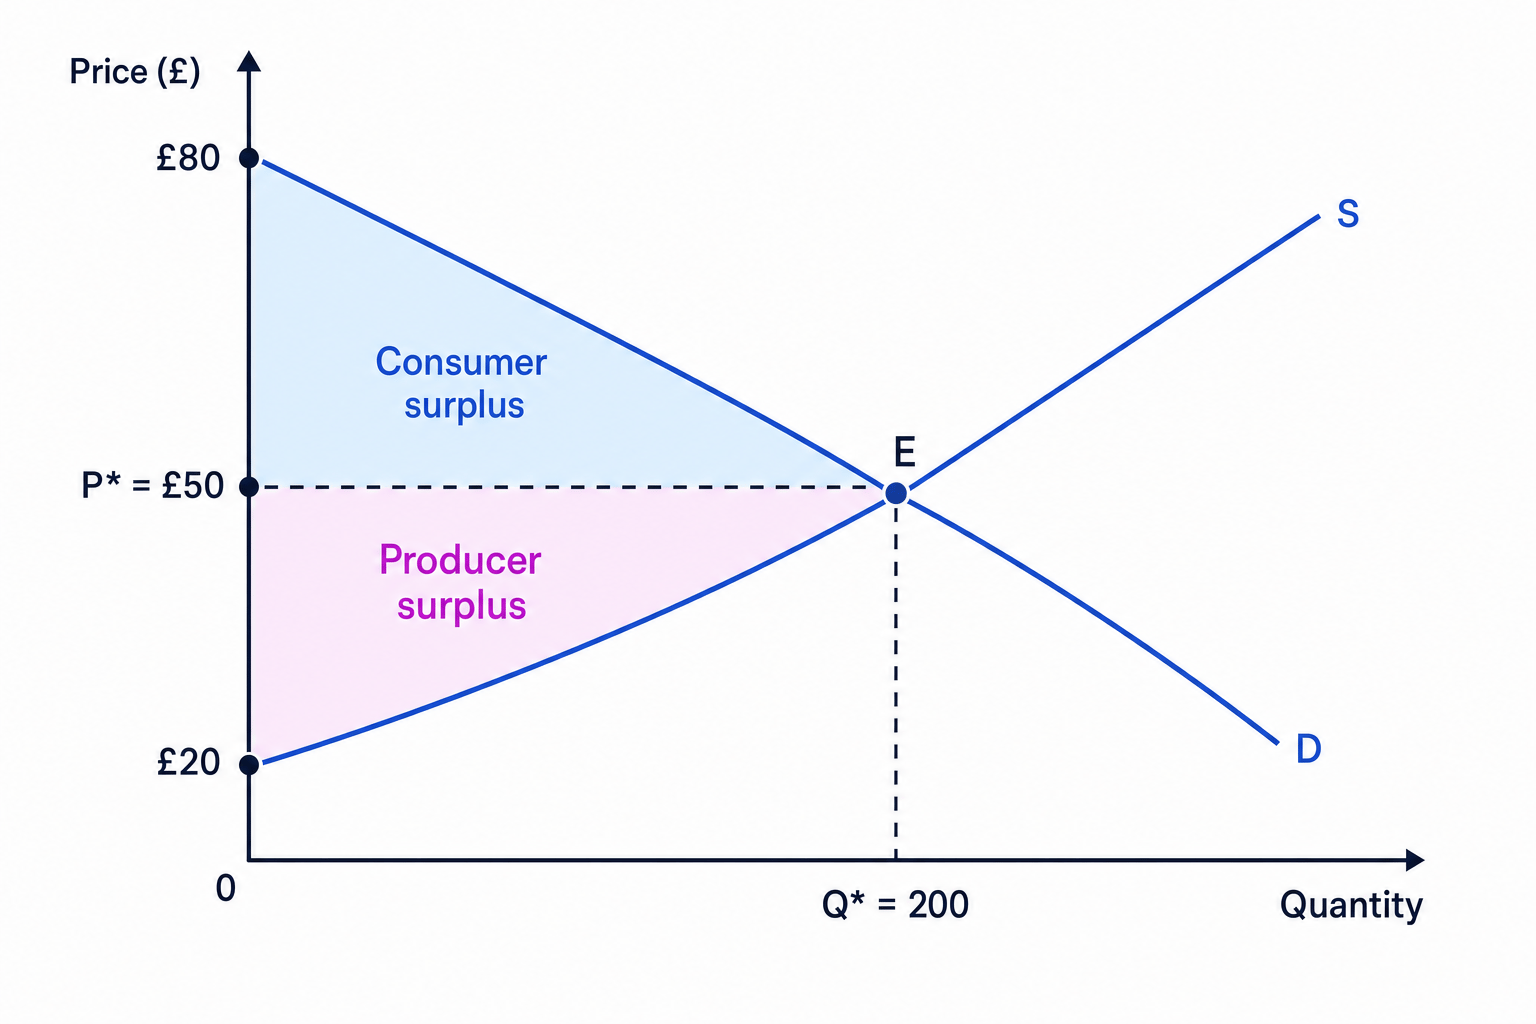
A demand curve can be read as consumers' maximum willingness to pay for each unit. A supply curve can be read as producers' minimum willingness to accept, often linked to marginal cost.
Consumer and producer surplus Lesson
Step-by-step lessons on Eduqas A Level Economics Consumer and producer surplus. Each one builds up to exam-style questions. Start with the core supply-and-demand models before moving on to the more evaluation-heavy macroeconomic policy topics.