

What you'll learn
- How to define, calculate and interpret PED, YED, XED and PES.
- Why price elasticity of demand matters for total revenue.
- How income elasticity distinguishes normal, luxury and inferior goods.
- How elasticities affect the incidence of taxes and subsidies between consumers and producers.
The basic idea: responsiveness
In demand and supply analysis, economists often want to know not just whether a variable changes, but how strongly it responds. That is what elasticity measures.
Elasticity
Elasticity is a measure of the responsiveness of one economic variable to a change in another variable, expressed using percentage changes.
Elasticity calculations usually assume ceteris paribus, meaning “all other things being equal”. For example, when calculating the effect of a price rise on demand, we assume income, tastes, advertising and competitors’ prices do not change at the same time.
The general percentage change formula is:
%Δ=new value−original valueoriginal value×100\% \Delta = \frac{\text{new value} - \text{original value}}{\text{original value}} \times 100%Δ=original valuenew value−original value×100Keep the sign
A fall gives a negative percentage change. For example, quantity falling from 1,000 to 900 is a change of -10%, not +10%.
Price elasticity of demand (PED)
Price elasticity of demand
Price elasticity of demand (PED) measures the responsiveness of quantity demanded to a change in price.
PED=%ΔQd%ΔP\text{PED} = \frac{\% \Delta Q_d}{\% \Delta P}PED=%ΔP%ΔQdBecause price and quantity demanded usually move in opposite directions, PED is normally negative. In your interpretation, use both the sign and the magnitude.
- If ∣PED∣<1|\text{PED}| < 1∣PED∣<1, demand is price inelastic: quantity demanded changes proportionately less than price.
- If ∣PED∣=1|\text{PED}| = 1∣PED∣=1, demand is unitary elastic: quantity demanded changes by the same proportion as price.
- If ∣PED∣>1|\text{PED}| > 1∣PED∣>1, demand is price elastic: quantity demanded changes proportionately more than price.
PED is influenced by factors such as the availability of substitutes, whether the good is a necessity or luxury, the proportion of income spent on it, brand loyalty, habit/addiction, and the time period considered.
Calculating PED
A train company raises the price of a weekly ticket from £50 to £55. Weekly ticket sales fall from 20,000 to 18,800.
-
Calculate the percentage change in price:
55−5050×100=10%\frac{55 - 50}{50} \times 100 = 10\%5055−50×100=10% -
Calculate the percentage change in quantity demanded:
18,800−20,00020,000×100=−6%\frac{18{,}800 - 20{,}000}{20{,}000} \times 100 = -6\%20,00018,800−20,000×100=−6% -
Substitute into the PED formula:
PED=−6%10%=−0.6\text{PED} = \frac{-6\%}{10\%} = -0.6PED=10%−6%=−0.6 -
Interpret the answer: demand is price inelastic, because the magnitude is less than 1. Quantity demanded falls proportionately less than price rises.
Ignoring the word proportionate
Elasticity is not about the absolute size of the change. A fall of 1,000 units might be huge for a small firm but tiny for a large market. Always compare percentage changes.
PED and total revenue
Total revenue
Total revenue (TR) is the money a firm receives from sales.
TR=P×Q\text{TR} = P \times QTR=P×QThe link between PED and total revenue is very important for firms deciding whether to raise or lower prices.
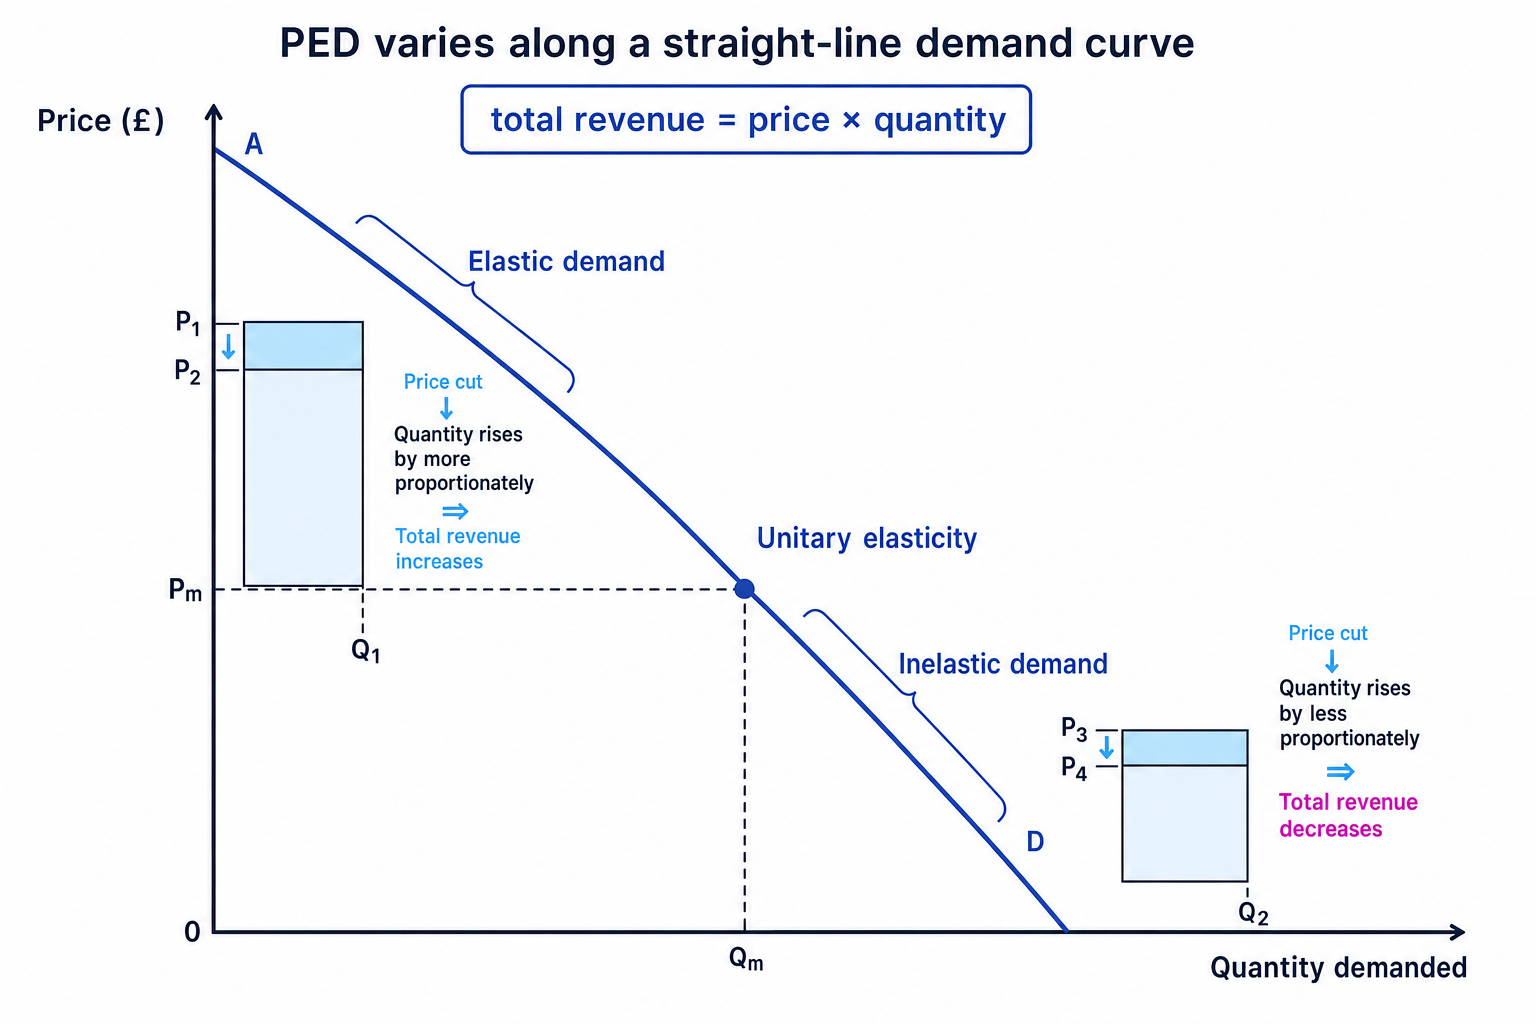
- If demand is price elastic, a price cut increases total revenue because quantity demanded rises more than proportionately.
- If demand is price inelastic, a price rise increases total revenue because quantity demanded falls less than proportionately.
- If demand is unitary elastic, total revenue stays unchanged for a small price change.
On a straight-line downward-sloping demand curve, PED varies along the curve. It is elastic near the top, unitary at the midpoint, and inelastic near the bottom. The slope is constant, but elasticity changes because the price and quantity bases change.
Using PED to predict total revenue
A streaming service charges £20 per month and has 1,000 subscribers. It estimates PED is -1.5 and considers cutting price by 10%.
-
Use PED to estimate the percentage change in quantity demanded:
−1.5=%ΔQd−10%-1.5 = \frac{\% \Delta Q_d}{-10\%}−1.5=−10%%ΔQdSo quantity demanded is expected to rise by 15%.
-
Calculate the new quantity:
1,000×1.15=1,1501{,}000 \times 1.15 = 1{,}1501,000×1.15=1,150 -
Calculate old and new total revenue:
Old TR=20×1,000=£20,000\text{Old TR} = 20 \times 1{,}000 = \text{£}20{,}000Old TR=20×1,000=£20,000 New TR=18×1,150=£20,700\text{New TR} = 18 \times 1{,}150 = \text{£}20{,}700New TR=18×1,150=£20,700 -
Conclude that total revenue rises by £700, so the price cut may be worthwhile if costs do not rise too much.
Elasticity estimates can change
PED estimates are most reliable for small price changes. For large changes, consumers may behave differently, and PED may change along the demand curve.
Income elasticity of demand (YED)
Income elasticity of demand
Income elasticity of demand (YED) measures the responsiveness of quantity demanded to a change in consumer income.
YED=%ΔQd%ΔY\text{YED} = \frac{\% \Delta Q_d}{\% \Delta Y}YED=%ΔY%ΔQdYED helps classify goods:
- Normal goods have positive YED: demand rises when income rises.
- Necessities usually have YED between 0 and 1: demand rises less than proportionately.
- Luxury goods have YED greater than 1: demand rises more than proportionately.
- Inferior goods have negative YED: demand falls when income rises.
During a cost-of-living squeeze, when real incomes fall, demand may rise for some inferior goods such as cheaper supermarket own-label products or second-hand goods.
Classifying goods using YED
Consumer incomes rise by 4%. Demand for premium gym memberships rises by 7%.
-
Substitute the percentage changes into the formula:
YED=7%4%=1.75\text{YED} = \frac{7\%}{4\%} = 1.75YED=4%7%=1.75 -
Interpret the sign: the YED is positive, so the good is a normal good.
-
Interpret the magnitude: because YED is greater than 1, demand is income elastic, so this is likely to be a luxury or discretionary service.
Cross price elasticity of demand (XED)
Cross price elasticity of demand
Cross price elasticity of demand (XED) measures the responsiveness of demand for one good to a change in the price of another good.
XEDA,B=%ΔQdA%ΔPB\text{XED}_{A,B} = \frac{\% \Delta Q_{dA}}{\% \Delta P_B}XEDA,B=%ΔPB%ΔQdAXED is mainly about the relationship between goods.
- If XED is positive, the goods are substitutes. For example, if the price of coffee rises, demand for tea may rise.
- If XED is negative, the goods are complements. For example, if the price of printers rises, demand for printer ink may fall.
- If XED is close to zero, the goods are largely unrelated.
The larger the magnitude, the stronger the relationship between the goods.
Identifying substitutes using XED
The price of butter rises by 20%. Demand for margarine rises by 8%.
-
Identify the affected demand: quantity demanded for margarine changes because the price of butter changes.
-
Substitute into the formula:
XED=8%20%=0.4\text{XED} = \frac{8\%}{20\%} = 0.4XED=20%8%=0.4 -
Interpret the sign: XED is positive, so butter and margarine are substitutes.
-
Interpret the magnitude: 0.4 is relatively low, suggesting they are substitutes, but not perfect ones.
Price elasticity of supply (PES)
Price elasticity of supply
Price elasticity of supply (PES) measures the responsiveness of quantity supplied to a change in price.
PES=%ΔQs%ΔP\text{PES} = \frac{\% \Delta Q_s}{\% \Delta P}PES=%ΔP%ΔQsPES is usually positive because higher prices give producers an incentive to supply more.
- If PES is less than 1, supply is price inelastic.
- If PES equals 1, supply is unitary elastic.
- If PES is greater than 1, supply is price elastic.
PES depends on spare capacity, availability of stocks, how long production takes, factor mobility, storage possibilities and the time period. For example, UK housebuilding often has low PES in the short run because planning permission, land availability and construction labour are constraints. Manufactured goods may have higher PES if firms have spare capacity.
Calculating PES
The market price of strawberries rises from £2.00 to £2.40 per punnet. Farmers increase weekly supply from 10,000 to 11,000 punnets.
-
Calculate the percentage change in price:
2.40−2.002.00×100=20%\frac{2.40 - 2.00}{2.00} \times 100 = 20\%2.002.40−2.00×100=20% -
Calculate the percentage change in quantity supplied:
11,000−10,00010,000×100=10%\frac{11{,}000 - 10{,}000}{10{,}000} \times 100 = 10\%10,00011,000−10,000×100=10% -
Substitute into the formula:
PES=10%20%=0.5\text{PES} = \frac{10\%}{20\%} = 0.5PES=20%10%=0.5 -
Interpret the answer: supply is price inelastic, possibly because farmers cannot instantly grow more strawberries.
Applying elasticity: tax incidence
Incidence
Incidence means the distribution of the burden or benefit of a tax or subsidy between consumers and producers.
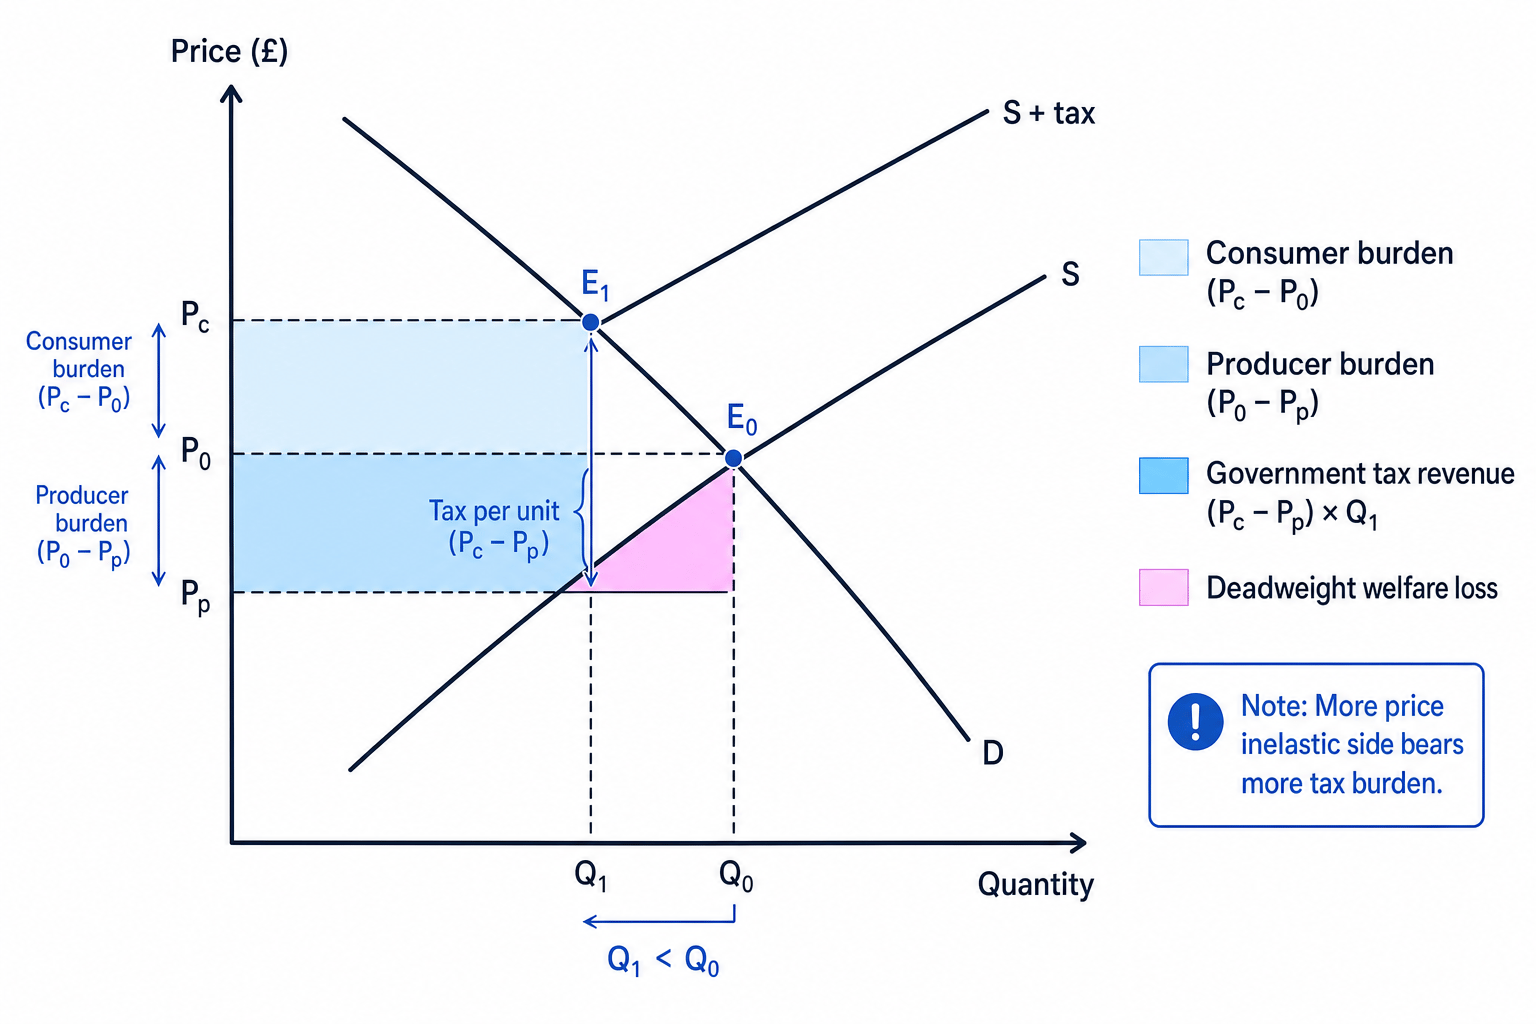
An indirect tax, such as fuel duty or a tax on sugary drinks, increases firms’ costs and shifts the supply curve upwards. The consumer pays a higher price, the producer receives a lower price after tax, and quantity traded falls.
The key rule is: the side of the market that is more price inelastic bears more of the burden. If demand is very inelastic, consumers cannot easily reduce consumption, so they pay more of the tax through a higher price.
Splitting a per-unit tax
A 40p per unit tax is placed on a product. Before the tax, the price was £1.00. After the tax, consumers pay £1.30, producers receive £0.90, and 10 million units are sold.
-
Calculate the consumer burden per unit:
£1.30−£1.00=£0.30\text{£}1.30 - \text{£}1.00 = \text{£}0.30£1.30−£1.00=£0.30 -
Calculate the producer burden per unit:
£1.00−£0.90=£0.10\text{£}1.00 - \text{£}0.90 = \text{£}0.10£1.00−£0.90=£0.10 -
Calculate government tax revenue:
£0.40×10,000,000=£4,000,000\text{£}0.40 \times 10{,}000{,}000 = \text{£}4{,}000{,}000£0.40×10,000,000=£4,000,000 -
Interpret the incidence: consumers bear 30p out of the 40p tax, so they bear 75% of the burden, suggesting demand is relatively price inelastic.
Applying elasticity: subsidy incidence
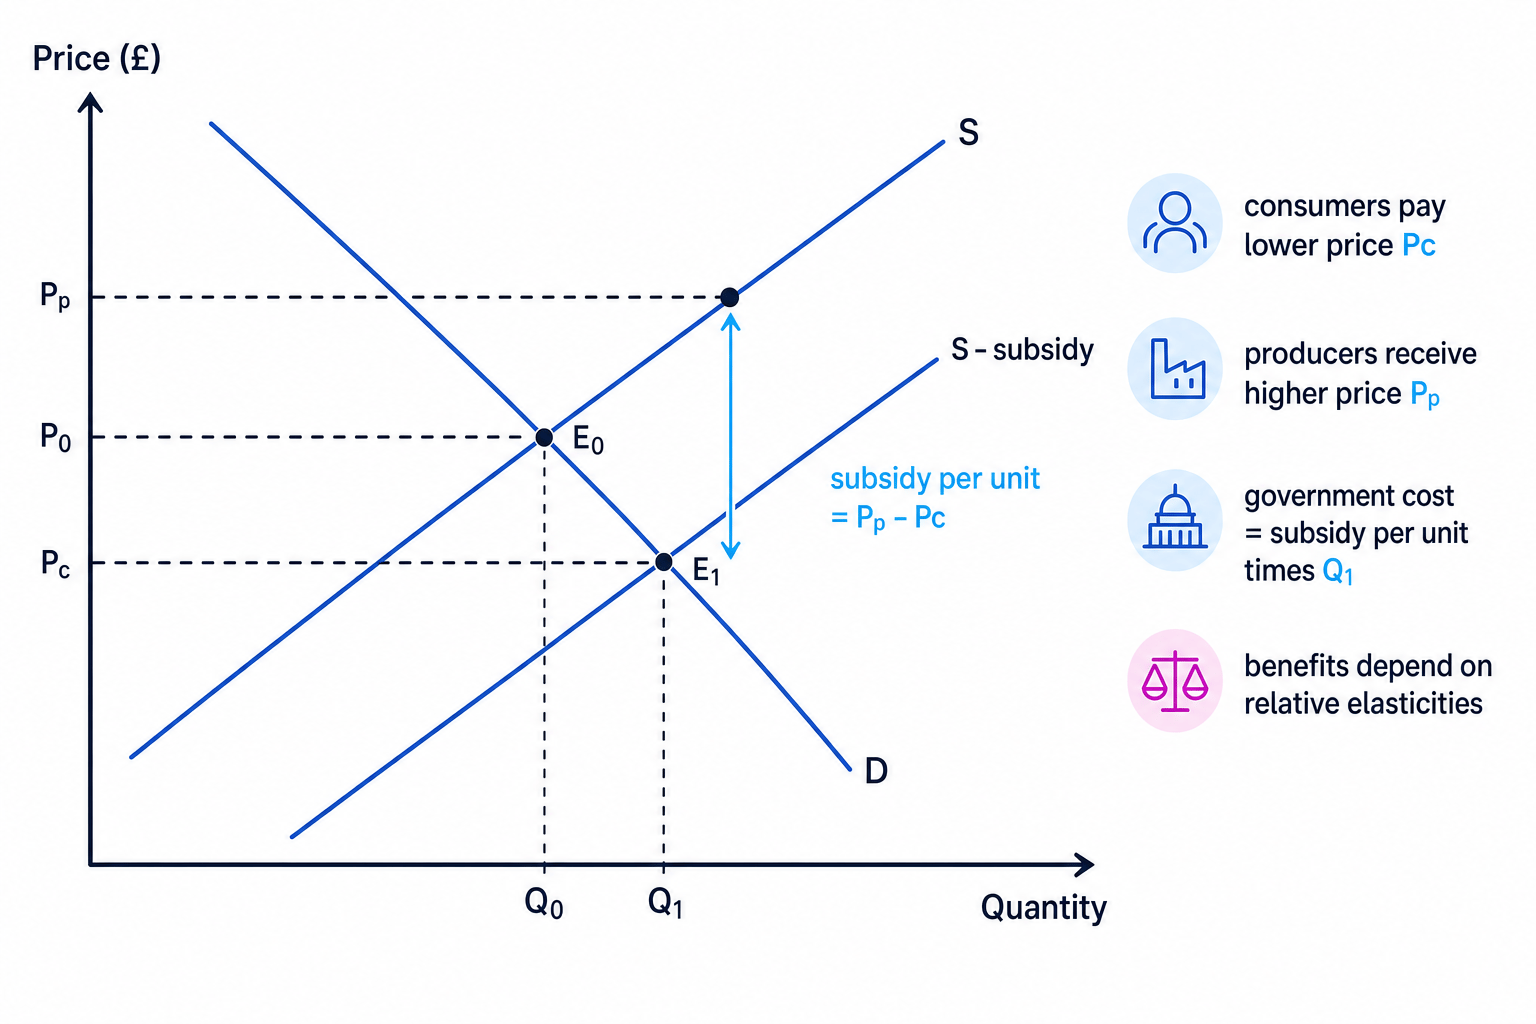
A subsidy is a payment to producers that reduces their costs. A per-unit subsidy shifts the supply curve downwards. Consumers pay a lower price, producers receive a higher effective price, and quantity traded rises.
Again, the side of the market that is more price inelastic usually gains more from the subsidy.
Splitting a subsidy
A £1,000 subsidy is given for each home insulation installation. The consumer price falls by £700, while installers receive £300 more per installation than before. 50,000 installations take place.
-
Calculate the benefit to consumers per installation: £700 of the £1,000 subsidy is passed on as a lower price.
-
Calculate the benefit to producers per installation: producers receive £300 more than before.
-
Calculate the government cost:
£1,000×50,000=£50,000,000\text{£}1{,}000 \times 50{,}000 = \text{£}50{,}000{,}000£1,000×50,000=£50,000,000 -
Interpret the incidence: consumers receive 70% of the subsidy benefit, suggesting demand may be relatively price inelastic compared with supply.
Why elasticity matters for decision-making
For firms, elasticity helps with pricing, revenue forecasts, product launches and competitor analysis. A firm with strong brand loyalty may face inelastic demand and have more pricing power. XED helps firms judge how vulnerable they are to rivals’ price cuts.
For governments, elasticity affects policy effectiveness. Taxes on goods with inelastic demand, such as cigarettes or fuel, may raise significant revenue, but may not reduce consumption much in the short run. Subsidies for public transport, childcare or green technology may be more effective if supply can expand; if PES is low, subsidies may mainly push up producer revenues rather than output.
Elasticity is powerful, not perfect
Elasticity helps predict direction and size of responses, but real-world decisions also depend on costs, objectives, time periods, fairness, externalities and data quality.
In the exam
- Define first, then calculate: state the relevant elasticity formula before using the numbers.
- Interpret the sign and magnitude: say whether the good is elastic/inelastic, normal/inferior, substitute/complement, and what that means.
- Apply to the context: link your answer to the market given, such as fuel, housing, food, public transport or digital subscriptions.
- Evaluate elasticity data: consider time period, availability of substitutes, data reliability and whether other factors changed at the same time.
Check yourself
- If PED is -0.3, what happens to total revenue when price rises?
- How would you tell from a YED value whether a good is inferior?
- In a tax diagram, which side bears more of the burden when demand is much more inelastic than supply?
