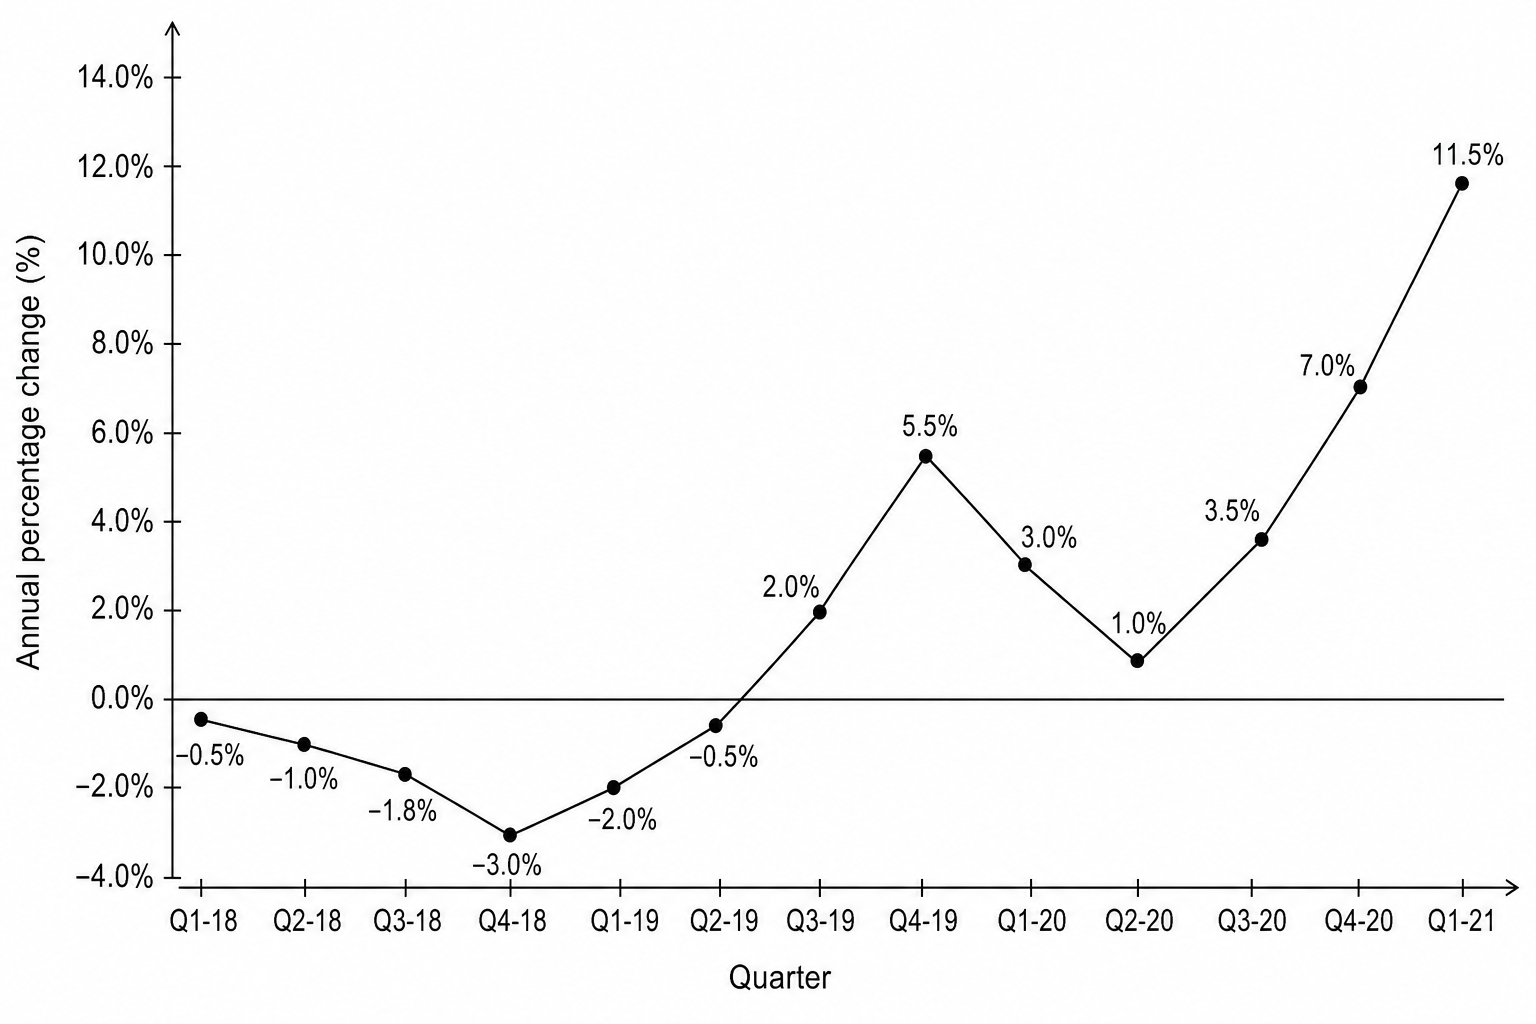
With reference to the chart and table below, explain the likely impact of a rise in average national housing prices on Australian consumer spending.
| Quarter | Annual percentage change (%) |
|---|---|
| Q1-18 | -0.5 |
| Q2-18 | -1.0 |
| Q3-18 | -1.8 |
| Q4-18 | -3.0 |
| Q1-19 | -2.0 |
| Q2-19 | -0.5 |
| Q3-19 | 2.0 |
| Q4-19 | 5.5 |
| Q1-20 | 3.0 |
| Q2-20 | 1.0 |
| Q3-20 | 3.5 |
| Q4-20 | 7.0 |
| Q1-21 | 11.5 |