

What you'll learn
- Why large animals need a mass transport system rather than relying on diffusion alone.
- How haemoglobin loads, carries and unloads oxygen, including the Bohr effect.
- How the mammalian double circulatory system, heart valves and cardiac cycle keep blood moving one way.
- How arteries, veins and capillaries are adapted, including tissue fluid formation and return.
Why animals need mass transport
Small organisms can often exchange substances directly across their body surface. Large multicellular animals cannot, because many cells are far from the outside environment and diffusion distances are too long.
A mass transport system moves substances in bulk around the body. In mammals, the transport fluid is blood, which carries oxygen, carbon dioxide, glucose, amino acids, hormones, urea and heat.
Mass transport
Mass transport is the bulk movement of substances from one part of an organism to another, usually in a fluid such as blood.
Mass transport maintains steep concentration gradients at exchange surfaces. For example, blood flow removes oxygen from the lungs and delivers it to respiring tissues, so diffusion can keep happening quickly.
Haemoglobin and red blood cells
Haemoglobins are a group of chemically similar oxygen-carrying proteins found in many organisms. Human haemoglobin is a protein with a quaternary structure, meaning it is made from more than one polypeptide chain. It has four polypeptide chains, each with a haem group containing an Fe²⁺ ion.
Each haem group can bind one oxygen molecule, so one haemoglobin molecule can carry up to four oxygen molecules. When oxygen binds, haemoglobin forms oxyhaemoglobin. This binding is reversible, so oxygen can be loaded in the lungs and unloaded in tissues.
Red blood cells are adapted for oxygen transport:
- They contain large amounts of haemoglobin.
- They are biconcave discs, giving a large surface area to volume ratio.
- Their thin centre gives a short diffusion pathway.
- Mature mammalian red blood cells have no nucleus and no mitochondria, giving more room for haemoglobin and preventing them using the oxygen they carry in aerobic respiration.
Haemoglobin is not a red blood cell
A red blood cell is the whole cell. Haemoglobin is the protein inside the red blood cell that binds oxygen.
Loading and unloading oxygen
The partial pressure of oxygen, written as pO2p\text{O}_2pO2, is a measure of oxygen concentration in a gas mixture or solution. A high pO2p\text{O}_2pO2 means oxygen is more available.
Affinity means how readily a molecule binds to another molecule. Haemoglobin with a high affinity for oxygen binds oxygen readily but releases it less easily.
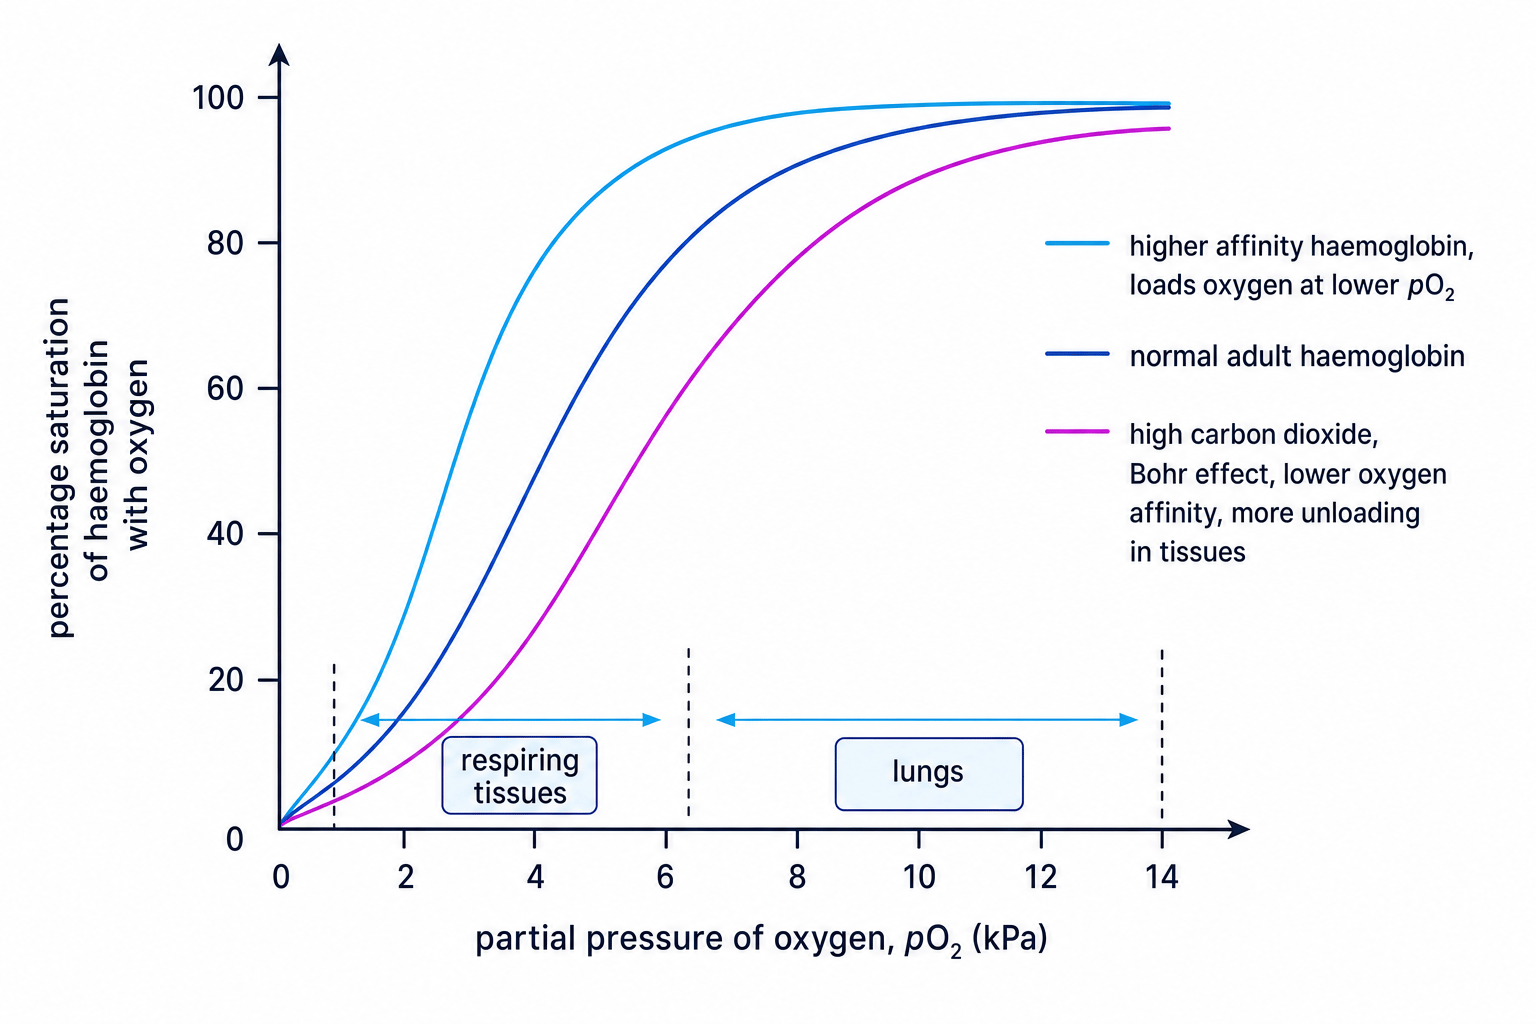
The oxyhaemoglobin dissociation curve shows the percentage saturation of haemoglobin with oxygen at different values of pO2p\text{O}_2pO2.
This graph pulls together the key ideas: loading in the lungs, unloading in tissues, and shifts caused by carbon dioxide or different haemoglobins.
Why the curve is sigmoid
The curve is sigmoid, or S-shaped, because oxygen binding is cooperative. When the first oxygen molecule binds to haemoglobin, it causes a change in shape. This makes it easier for the next oxygen molecules to bind.
At low pO2p\text{O}_2pO2, haemoglobin is not very saturated. At high pO2p\text{O}_2pO2, such as in the lungs, haemoglobin becomes almost fully saturated. In the steep middle section, a small fall in pO2p\text{O}_2pO2 causes a large amount of oxygen to be unloaded.
The Bohr effect
Respiring tissues produce carbon dioxide. A high carbon dioxide concentration lowers haemoglobin’s affinity for oxygen, so oxygen is released more readily. This is called the Bohr effect.
On the graph, increased carbon dioxide shifts the dissociation curve to the right. At the same pO2p\text{O}_2pO2, haemoglobin is less saturated, so more oxygen is unloaded.
Comparing oxygen unloading
A graph shows haemoglobin is 98% saturated in the lungs, 55% saturated in resting tissue, and 35% saturated in active tissue with high carbon dioxide.
- Calculate oxygen unloaded in resting tissue by subtracting tissue saturation from lung saturation: 98%−55%=4398\% - 55\% = 4398%−55%=43 percentage points.
- Calculate oxygen unloaded in active tissue: 98%−35%=6398\% - 35\% = 6398%−35%=63 percentage points.
- Compare the two values: active tissue receives 20 percentage points more oxygen because high carbon dioxide shifts the curve right and lowers haemoglobin’s oxygen affinity.
Different haemoglobins in different animals
Many animals have haemoglobin adapted to their environment. An animal living where oxygen availability is low may have haemoglobin with a higher oxygen affinity, shown by a curve shifted to the left. This helps it load oxygen at a lower pO2p\text{O}_2pO2.
However, very high affinity can make unloading harder, so the “best” haemoglobin depends on the animal’s environment and metabolic demand.
The mammalian circulatory system
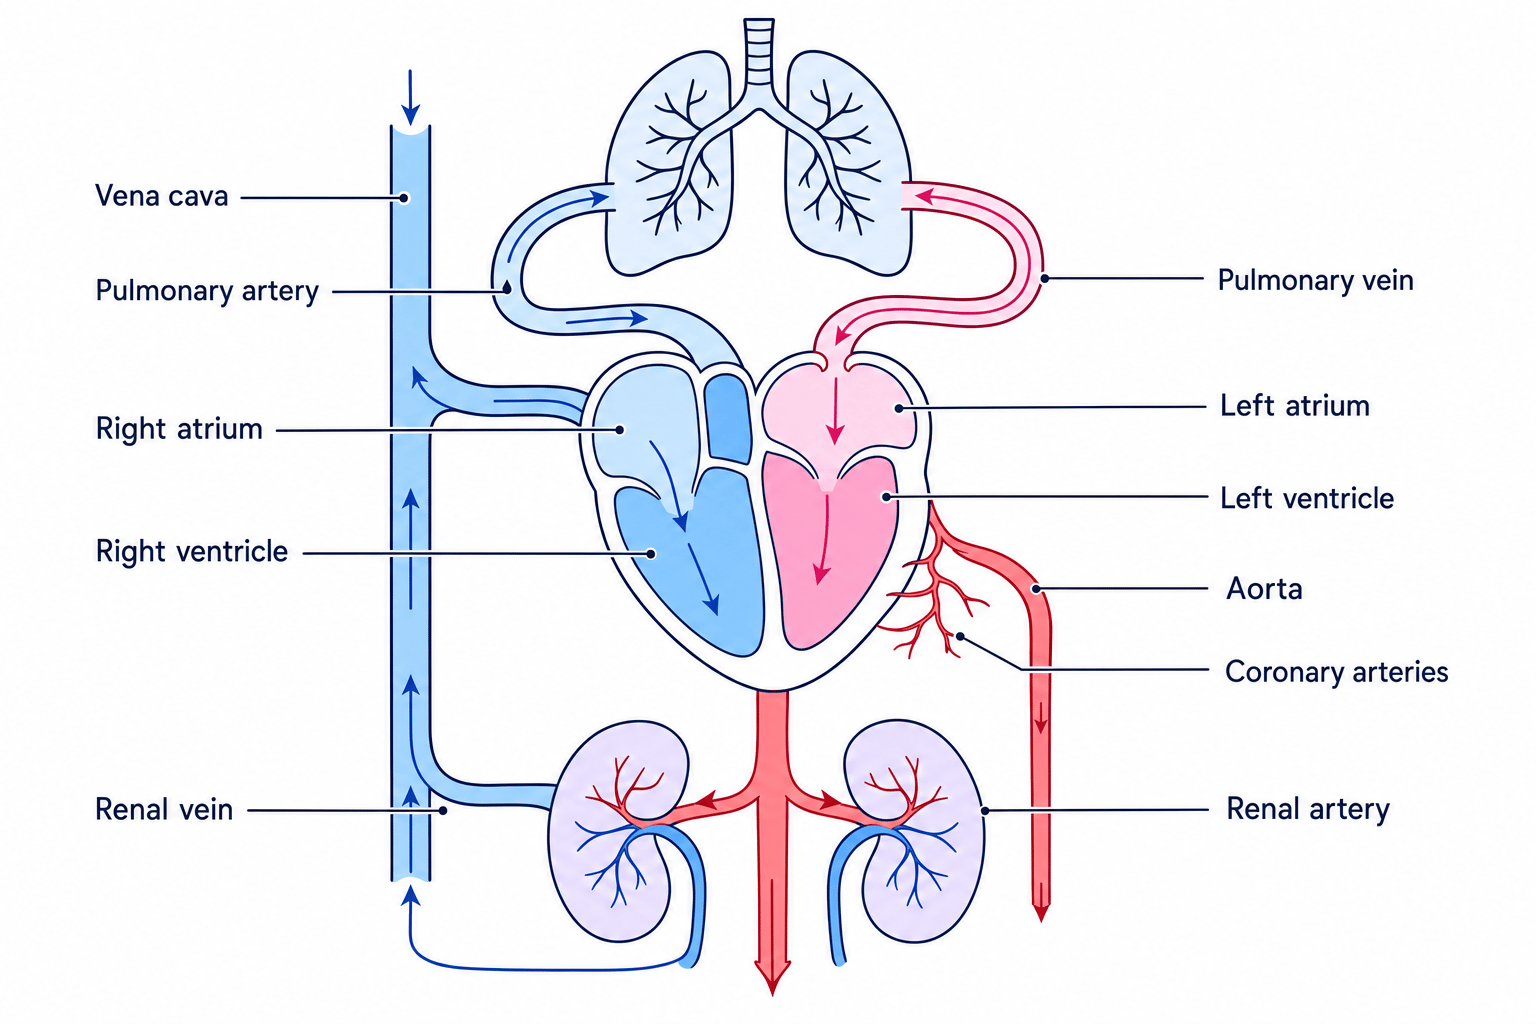
Mammals have a closed circulatory system, meaning blood stays inside vessels. They also have a double circulatory system, meaning blood passes through the heart twice during one complete circuit:
- Pulmonary circulation: heart to lungs and back.
- Systemic circulation: heart to body organs and back.
The main route is: vena cava → right atrium → right ventricle → pulmonary artery → lungs → pulmonary vein → left atrium → left ventricle → aorta → body. The kidneys receive blood through the renal artery and return it through the renal vein. The heart muscle itself is supplied by the coronary arteries.
Arteries are not always oxygenated
An artery carries blood away from the heart. A vein carries blood towards the heart. The pulmonary artery carries deoxygenated blood, and the pulmonary vein carries oxygenated blood.
Gross structure of the heart
The atria are the upper chambers that receive blood. The ventricles are the lower chambers that pump blood out of the heart. The left ventricle has a thicker muscular wall than the right ventricle because it pumps blood at higher pressure around the whole body.
The septum separates the left and right sides, preventing oxygenated and deoxygenated blood from mixing.
Valves maintain a unidirectional flow of blood:
- Atrioventricular valves are between atria and ventricles.
- Semilunar valves are at the bases of the aorta and pulmonary artery.
- Tendinous cords prevent atrioventricular valves turning inside out during ventricular contraction.
The cardiac cycle
The cardiac cycle is one complete heartbeat. Systole means contraction, and diastole means relaxation.
1. Diastole
The atria and ventricles relax. Blood enters the atria and flows into the ventricles. The atrioventricular valves are open, while the semilunar valves are closed.
2. Atrial systole
The atria contract, pushing the last blood into the ventricles. Ventricular volume increases slightly.
3. Ventricular systole
The ventricles contract. When ventricular pressure becomes higher than atrial pressure, the atrioventricular valves close. When ventricular pressure becomes higher than pressure in the aorta or pulmonary artery, the semilunar valves open and blood is ejected.
When ventricles relax again, ventricular pressure falls below artery pressure, so the semilunar valves close.
How to work out valve movement
Valves do not open because they “choose” to. They open or close because of pressure differences on either side.
Using pressure to predict valve movement
At one moment, left ventricular pressure is 16 kPa, left atrial pressure is 1 kPa, and aortic pressure is 11 kPa.
- Compare ventricle with atrium: 16 kPa>1 kPa16\ \text{kPa} > 1\ \text{kPa}16 kPa>1 kPa, so blood would tend to move back into the atrium unless the atrioventricular valve closes.
- Compare ventricle with aorta: 16 kPa>11 kPa16\ \text{kPa} > 11\ \text{kPa}16 kPa>11 kPa, so the semilunar valve opens.
- Blood is being ejected from the left ventricle into the aorta, so this is ventricular systole and ventricular volume is decreasing.
Cardiac output
Heart rate is the number of heartbeats per minute. Stroke volume is the volume of blood pumped out of one ventricle per beat. Cardiac output is the volume of blood pumped by one ventricle per minute.
CO=stroke volume×heart rate\mathrm{CO} = \text{stroke volume} \times \text{heart rate}CO=stroke volume×heart rateCalculating stroke volume
A student has a cardiac output of 5.6 dm³ min⁻¹ and a heart rate of 70 beats min⁻¹.
- Rearrange the equation to make stroke volume the subject: stroke volume=COheart rate\text{stroke volume} = \frac{\mathrm{CO}}{\text{heart rate}}stroke volume=heart rateCO.
- Substitute the values with units:
- Convert if useful: 0.080 dm³ is 80 cm³, so each beat pumps 80 cm³ of blood from one ventricle.
Blood vessels
A lumen is the central space inside a blood vessel.
| Vessel | Structure | Function |
|---|---|---|
| Artery | Thick wall with lots of elastic tissue and smooth muscle; small lumen | Withstands high pressure and uses elastic recoil to smooth blood flow |
| Arteriole | Small artery with lots of smooth muscle | Controls blood flow into capillary beds by changing lumen diameter |
| Vein | Thinner wall, less elastic tissue and muscle, large lumen, valves | Returns blood at low pressure and prevents backflow |
| Capillary | Wall is one cell thick, made of endothelium; very narrow lumen | Provides a short diffusion distance for exchange |
A capillary bed is a network of capillaries supplying a tissue. Capillaries are important exchange surfaces because they are numerous, narrow, thin-walled and close to cells.
Tissue fluid and lymph
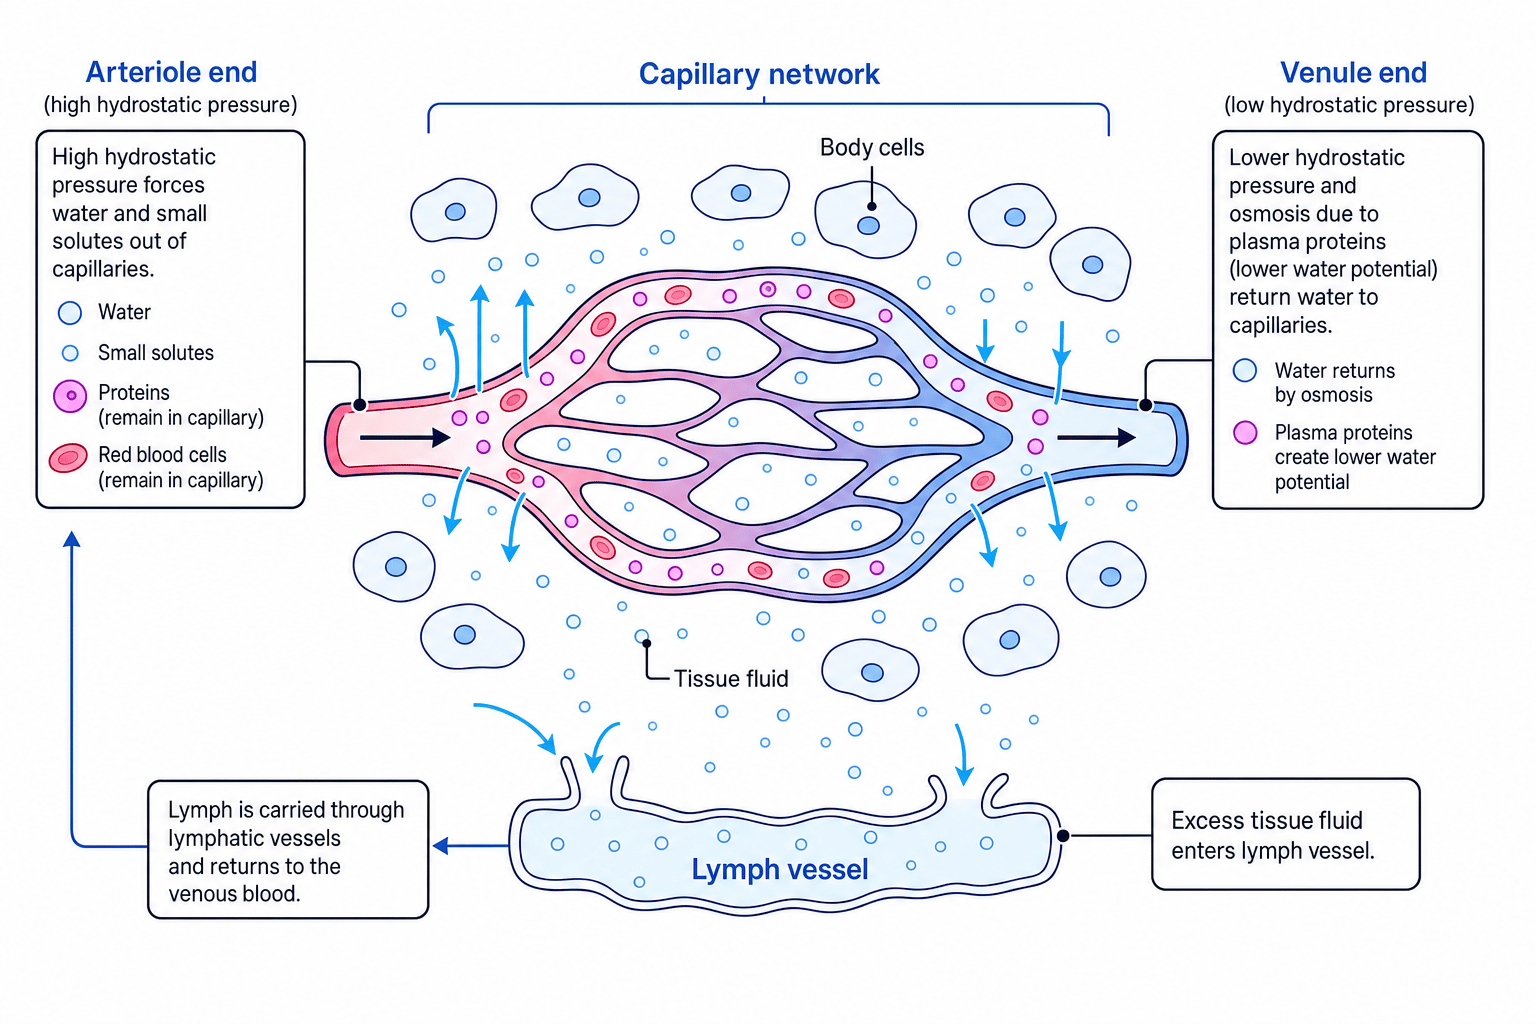
Tissue fluid is the fluid surrounding body cells. It is formed from blood plasma, but it contains very few plasma proteins and no red blood cells because these are too large to pass through capillary walls.
At the arteriole end of a capillary, hydrostatic pressure — the pressure exerted by a fluid — is high. This forces water and small solutes out of the capillary. At the venule end, hydrostatic pressure is lower, and plasma proteins remaining in the blood lower the water potential of the plasma, so water moves back into the capillary by osmosis. Excess tissue fluid enters lymph vessels as lymph and eventually returns to the blood.
Predicting fluid movement in a capillary
Suppose the outward hydrostatic pressure is 4.6 kPa at the arteriole end and 2.0 kPa at the venule end. The inward pull due to plasma proteins is 3.3 kPa.
- At the arteriole end, compare the pressures: 4.6 kPa−3.3 kPa=1.3 kPa4.6\ \text{kPa} - 3.3\ \text{kPa} = 1.3\ \text{kPa}4.6 kPa−3.3 kPa=1.3 kPa outward, so tissue fluid forms.
- At the venule end, compare again: 2.0 kPa−3.3 kPa=−1.3 kPa2.0\ \text{kPa} - 3.3\ \text{kPa} = -1.3\ \text{kPa}2.0 kPa−3.3 kPa=−1.3 kPa, so the net movement is back into the capillary.
- Any excess fluid that is not reabsorbed enters lymph vessels and is returned to the circulatory system.
Cardiovascular disease data
Cardiovascular disease means disease of the heart or blood vessels. A risk factor is something associated with an increased chance of disease, such as smoking, high blood pressure, high blood cholesterol, obesity, inactivity, age, diabetes or genetic factors.
A correlation means two variables are associated. A causal relationship means one variable directly contributes to the change in the other. A confounding variable is another factor that may affect the result, making the relationship harder to interpret.
Judging a risk-factor claim
A study finds that people who do little exercise have a higher incidence of cardiovascular disease, but they also have higher average smoking rates.
- Identify the correlation: lower exercise is associated with higher cardiovascular disease incidence.
- Consider the confounder: smoking could independently increase cardiovascular disease risk, so exercise may not be the only explanation.
- Evaluate causation by asking whether the study controlled smoking, used a large sample, showed a dose-response pattern, and fits a plausible biological mechanism.
Required practical 5: dissection
You may dissect an animal or plant gas exchange or mass transport system, or an organ within one. For this topic, a mammalian heart dissection is common.
Required practical 5
You should be able to describe safe dissection using appropriate tools, identify visible structures such as chambers, valves, major blood vessels and coronary arteries, compare left and right ventricle wall thickness, and produce clear labelled biological drawings.
In the exam
- For dissociation curves, quote values from the axes and explain shifts using affinity, loading and unloading.
- For cardiac cycle questions, compare pressures on either side of each valve; valve movement follows pressure differences.
- For cardiovascular disease data, separate correlation from causation and mention confounding variables, sample size and biological mechanism.
Check yourself
- Why does cooperative binding make the oxyhaemoglobin dissociation curve sigmoid?
- During ventricular systole, what happens to the atrioventricular and semilunar valves?
- How is tissue fluid formed, and how does excess tissue fluid return to the blood?
