What you'll learn
- What biodiversity means, from a tiny local habitat to the whole Earth.
- How species richness differs from diversity.
- How to calculate and interpret the AQA index of diversity, ddd.
- Why farming often reduces biodiversity, and how conservation can be balanced with food production.
The starting point: organisms, habitats and communities
A habitat is the place where an organism lives. A habitat can be very small, such as a rotting log, or very large, such as a tropical rainforest.
A community is all the populations of different species living and interacting in the same habitat at the same time.
A population is all the organisms of one species in a particular area at a particular time.
Biodiversity
Biodiversity is the variety of living organisms in an area. In this topic, you focus mainly on biodiversity within a community, especially the number of species present and the number of individuals in each species.
Biodiversity can be considered at many scales. You might compare biodiversity in two quadrats in a school field, two woodlands, two countries, or even the whole Earth.
Scale matters
When you describe biodiversity, always say the scale you are talking about: a small local habitat, a whole ecosystem, a country, or the Earth.
Species richness
Species richness
Species richness is the number of different species in a community.
Species richness does not tell you how many individuals of each species there are. It only counts how many different species are present.
For example, a pond containing five species of invertebrate has a higher species richness than a pond containing two species of invertebrate.
But species richness alone can be misleading. Two communities can have the same number of species but very different distributions of individuals.
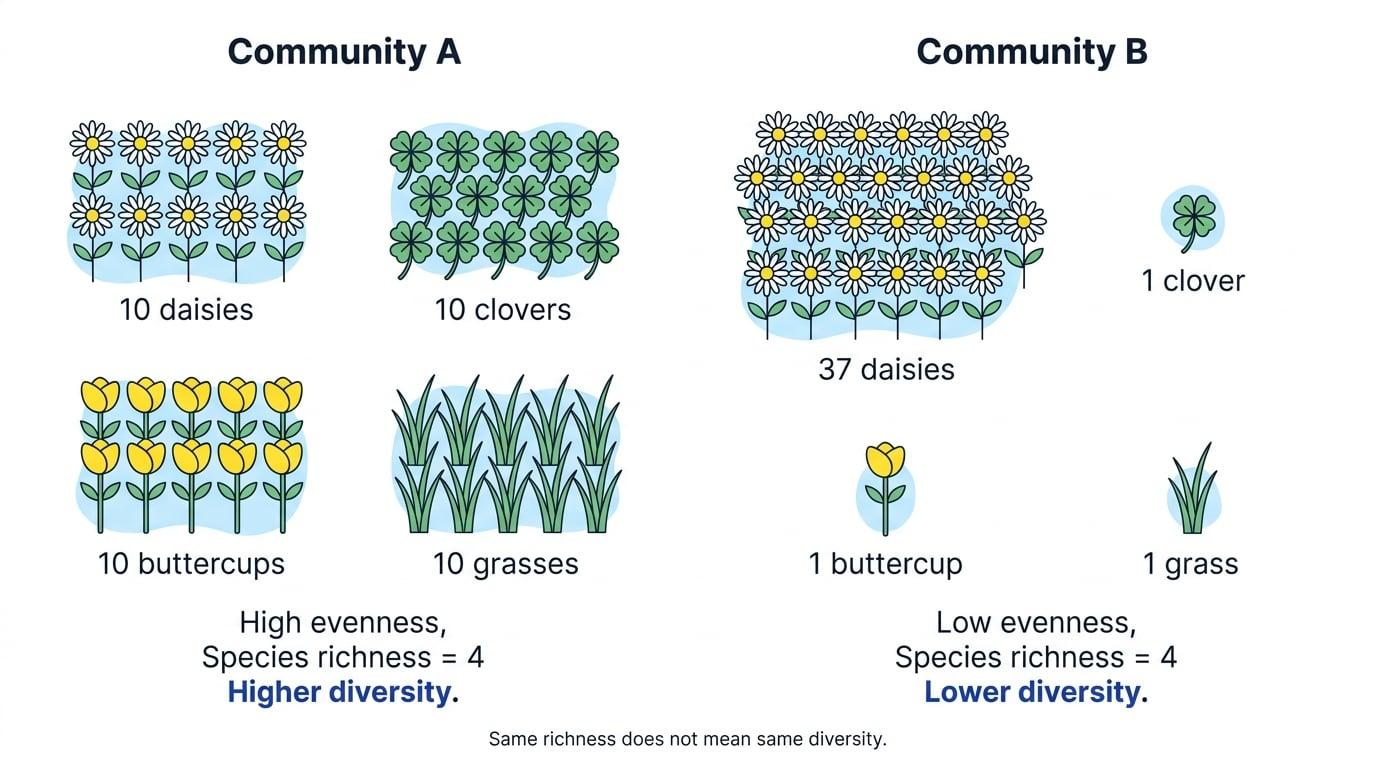
The diagram below shows why species richness is only part of the story.
Evenness: how evenly individuals are shared between species
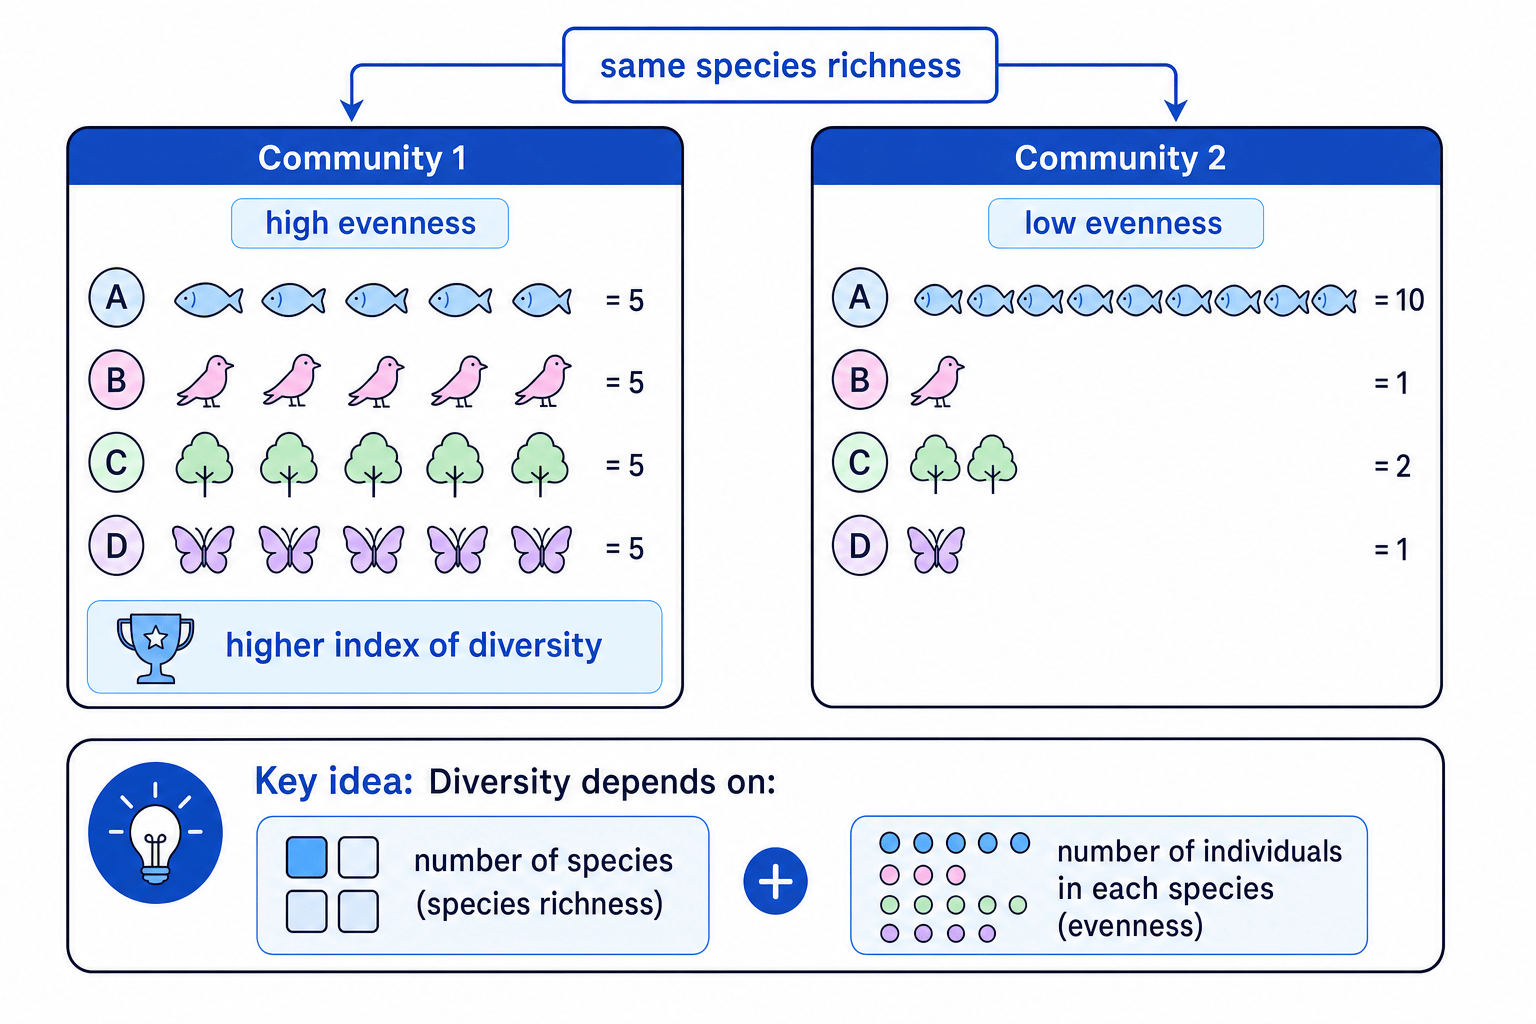
Evenness means how similar the abundances of different species are. A community has high evenness if individuals are spread fairly evenly between species.
A community has low evenness if one species is very common and the others are rare.
Comparing richness and evenness
Two grassland samples contain the following species:
- Sample A: 10 daisies, 10 clovers, 10 buttercups, 10 grasses
- Sample B: 37 daisies, 1 clover, 1 buttercup, 1 grass
-
Count the number of different species in each sample. Both samples contain daisies, clovers, buttercups and grasses, so both have a species richness of 4.
-
Compare how the individuals are distributed. In Sample A, each species has 10 individuals, so abundance is evenly shared.
-
In Sample B, daisies dominate the sample and the other species are rare, so evenness is low.
-
Therefore, Sample A has greater diversity even though both samples have the same species richness.
Richness is not the same as diversity
Do not say a community is more diverse just because it has more individuals overall. Diversity depends on the number of species and how individuals are distributed between those species.
The index of diversity
Species richness gives a simple count, but ecologists often need a more useful measure that includes both:
- the number of different species
- the number of individuals in each species
This is where the index of diversity comes in.
Index of diversity
An index of diversity describes the relationship between the number of species in a community and the number of individuals in each species.
For AQA A-Level Biology, you need to calculate the index of diversity using:
d=N(N−1)∑n(n−1)d = \frac{N(N-1)}{\sum n(n-1)}d=∑n(n−1)N(N−1)where:
- ddd = index of diversity
- NNN = total number of organisms of all species
- nnn = total number of organisms of each species
- ∑\sum∑ means “the sum of”, so you add together the n(n−1)n(n-1)n(n−1) value for every species
Counts of organisms are treated as dimensionless counts, so the index of diversity has no units.
Interpreting d
A higher value of ddd means greater species diversity. This usually means there are more species, a more even distribution of individuals, or both.
Calculating the index of diversity
A reliable method is:
- Add all the organisms to find NNN.
- For each species, calculate n(n−1)n(n-1)n(n−1).
- Add all the n(n−1)n(n-1)n(n−1) values to find ∑n(n−1)\sum n(n-1)∑n(n−1).
- Substitute into the formula.
- State that ddd has no units.
Calculating an index of diversity
A student samples a meadow and records the following results:
| Species | Number of organisms |
|---|---|
| Daisy | 18 |
| Clover | 12 |
| Grass | 15 |
| Buttercup | 5 |
Calculate the index of diversity.
-
Find the total number of organisms:
N=18+12+15+5=50N = 18 + 12 + 15 + 5 = 50N=18+12+15+5=50 -
Calculate n(n−1)n(n-1)n(n−1) for each species:
Daisy:18(18−1)=18×17=306Clover:12(12−1)=12×11=132Grass:15(15−1)=15×14=210Buttercup:5(5−1)=5×4=20\begin{aligned} \text{Daisy} &: 18(18-1) = 18 \times 17 = 306 \\ \text{Clover} &: 12(12-1) = 12 \times 11 = 132 \\ \text{Grass} &: 15(15-1) = 15 \times 14 = 210 \\ \text{Buttercup} &: 5(5-1) = 5 \times 4 = 20 \end{aligned}DaisyCloverGrassButtercup:18(18−1)=18×17=306:12(12−1)=12×11=132:15(15−1)=15×14=210:5(5−1)=5×4=20 -
Add these values to find the denominator:
∑n(n−1)=306+132+210+20=668\sum n(n-1) = 306 + 132 + 210 + 20 = 668∑n(n−1)=306+132+210+20=668 -
Substitute into the formula:
d=N(N−1)∑n(n−1)d=50(50−1)668d=2450668d=3.67\begin{aligned} d &= \frac{N(N-1)}{\sum n(n-1)} \\ d &= \frac{50(50-1)}{668} \\ d &= \frac{2450}{668} \\ d &= 3.67 \end{aligned}dddd=∑n(n−1)N(N−1)=66850(50−1)=6682450=3.67 -
The index of diversity is 3.67, with no units. This value can be compared with other samples collected using a similar method.
Check the denominator carefully
For each species, calculate n(n−1)n(n-1)n(n−1) first, then add the answers. Do not add all the nnn values first and then calculate n(n−1)n(n-1)n(n−1) for the total — that would just repeat the numerator.
Using n squared instead of n(n - 1)
The formula uses n(n−1)n(n-1)n(n−1), not n2n^2n2. Similarly, the numerator is N(N−1)N(N-1)N(N−1), not N2N^2N2.
Interpreting index values
The index of diversity is most useful when comparing communities.
If two habitats are sampled in a valid, comparable way:
- the habitat with the higher value of ddd has greater diversity
- the habitat with the lower value of ddd has lower diversity
A low index of diversity may mean:
- there are very few species
- one species dominates the community
- the habitat has been disturbed or simplified
A high index of diversity may mean:
- there are many species
- individuals are more evenly spread between species
- the habitat contains many niches and food sources
Niche
A niche is the role of a species in its ecosystem, including where it lives, what it eats, and how it interacts with other organisms.
Interpreting diversity data
Two fields are sampled using the same method.
- Field A has an index of diversity of 9.8.
- Field B has an index of diversity of 2.1.
-
Compare the values directly because the same sampling method was used. Field A has the higher value of ddd.
-
Link the value to biodiversity. Field A has greater species diversity than Field B.
-
Explain what this suggests biologically. Field A probably has more species, a more even spread of individuals between species, or both.
-
Avoid overclaiming. The index alone does not prove the exact cause of the difference; it only describes the sampled diversity.
Only compare like with like
Index values are most meaningful when samples are collected using similar methods, similar sampling effort, and similar-sized areas. Poor sampling can make biodiversity estimates unreliable.
How farming techniques reduce biodiversity
Farming aims to maximise food production. This often simplifies ecosystems, which can reduce biodiversity.
Monoculture
Monoculture
Monoculture is the growth of one crop species over a large area.
Monoculture reduces species richness because many wild plant species are removed. Fewer plant species means fewer food sources and habitats for insects, birds and other animals.
Removal of hedgerows and woodland
Hedgerows provide:
- nesting sites for birds
- shelter for small mammals
- food sources such as berries, flowers and insects
- corridors that allow animals to move between habitats
Removing hedgerows creates larger fields for machinery, but it also removes habitats and reduces biodiversity.
Pesticides and herbicides
Pesticides are chemicals used to kill pests, such as insects that feed on crops.
Herbicides are chemicals used to kill unwanted plants, often called weeds.
These can reduce biodiversity because:
- pesticides may kill non-target insects
- fewer insects means less food for birds and bats
- herbicides reduce wild plant species
- fewer wild plants means fewer niches for animals
Fertilisers
Fertilisers increase crop growth by adding mineral ions such as nitrate ions. However, fertilisers can reduce biodiversity if they favour a small number of fast-growing species.
If fertiliser runs into ponds, streams or rivers, it can cause eutrophication. This may lead to algal blooms, reduced light penetration, death of aquatic plants, increased decomposition, and reduced oxygen availability for aquatic animals.
Farming simplifies ecosystems
Many farming techniques increase yield by making conditions better for the crop, but worse for many other species. This usually reduces species richness and the index of diversity.
Balancing conservation and farming
Farmers need to produce enough food and make a living. Conservation aims to protect biodiversity and maintain ecosystems. The challenge is to balance both.
Conservation-friendly farming methods include:
- leaving or replanting hedgerows
- creating wildflower field margins
- using pesticides only when necessary
- using biological control or integrated pest management
- rotating crops to maintain soil fertility
- reducing fertiliser runoff using buffer strips near water
- maintaining ponds, woodland patches and uncultivated areas
These methods can increase biodiversity by providing more habitats, food sources and breeding sites.
However, they may also:
- reduce the area available for crops
- increase costs for farmers
- require more labour or planning
- sometimes reduce short-term yield
The balance
The aim is not simply “farming versus nature”. Good management can support food production while also protecting habitats, pollinators, soil quality and long-term ecosystem stability.
Evaluating a conservation strategy
A farmer leaves a 3 m wildflower strip around a wheat field instead of planting wheat right up to the edge.
-
Identify the biodiversity benefit. The wildflower strip provides nectar, seeds and shelter, so it can increase plant, insect and bird diversity.
-
Link this to the index of diversity. More plant species and a more even distribution of animal species could increase the value of ddd in the field margin.
-
Consider the farming cost. Some land is no longer used for wheat, so the farmer may produce slightly less crop from that field.
-
Balance the judgement. The strategy may be worthwhile if benefits such as pollination, natural pest control and conservation payments help offset the loss of crop area.
In the exam
-
When defining species richness, say it is the number of different species in a community, not the number of individuals.
-
For the index of diversity, calculate NNN, then each n(n−1)n(n-1)n(n−1) value, then ∑n(n−1)\sum n(n-1)∑n(n−1) before substituting into the formula.
-
State that a higher value of ddd means greater diversity, but only make valid comparisons when sampling methods are comparable.
-
When explaining farming effects, link the technique to habitats, food sources, species richness or evenness — avoid vague phrases like “it harms nature”.
-
For conservation questions, discuss both sides: food production and farmer income as well as biodiversity and ecosystem protection.
Check yourself
- What is the difference between species richness and an index of diversity?
- Why can two communities with the same species richness have different biodiversity?
- How can removing hedgerows reduce the index of diversity in farmland?