

Welcome to the final part of the genetic diversity topic! You already know what genetic diversity is—the number of different alleles of genes in a population. But how do biologists actually measure it in the real world?
What you'll learn:
- Why we have moved from observing physical traits to directly sequencing DNA and proteins.
- How to interpret molecular sequences to figure out how closely related two species are.
- How to collect valid data using random sampling.
- How to interpret mean values and standard deviations to draw valid conclusions about variation.
The Shift in Investigating Diversity
Historically, if scientists wanted to figure out how much genetic diversity existed in a population, or how closely related two species were, they had to rely on what they could see.
The old way: Observable characteristics
The traditional method was to infer DNA differences by looking at observable characteristics (the organism's phenotype). If two organisms looked very similar, scientists assumed their DNA must be very similar.
However, there are two major problems with inferring genetic diversity from observable traits alone:
Polygenic inheritance
Many observable characteristics are polygenic, meaning they are coded for by more than one gene. This creates continuous variation, making it very hard to tease apart discrete genetic differences just by looking.
- Polygenic traits: Because many genes influence a single trait (like height or coat colour), it is impossible to trace a physical difference back to a single specific mutation in the DNA.
- Environmental influences: An organism's phenotype is a combination of its genotype and its environment. For example, a plant might be genetically capable of growing tall, but if it grows in poor, nutrient-deficient soil, it will be short. The environment masks the true genetic potential.
The new way: Gene technology
Gene technology has completely changed how we investigate diversity. We no longer have to guess what the DNA looks like based on a plant's height or an animal's fur. We can extract the genetic material and read the sequence directly.
Interpreting Molecular Data
Today, genetic diversity within a species, or evolutionary relationships between different species, can be measured by comparing four main things:
- The frequency of measurable characteristics (the modern, quantitative version of the old way).
- The base sequence of DNA.
- The base sequence of mRNA.
- The amino acid sequence of the proteins encoded by DNA and mRNA.
Comparing base and amino acid sequences
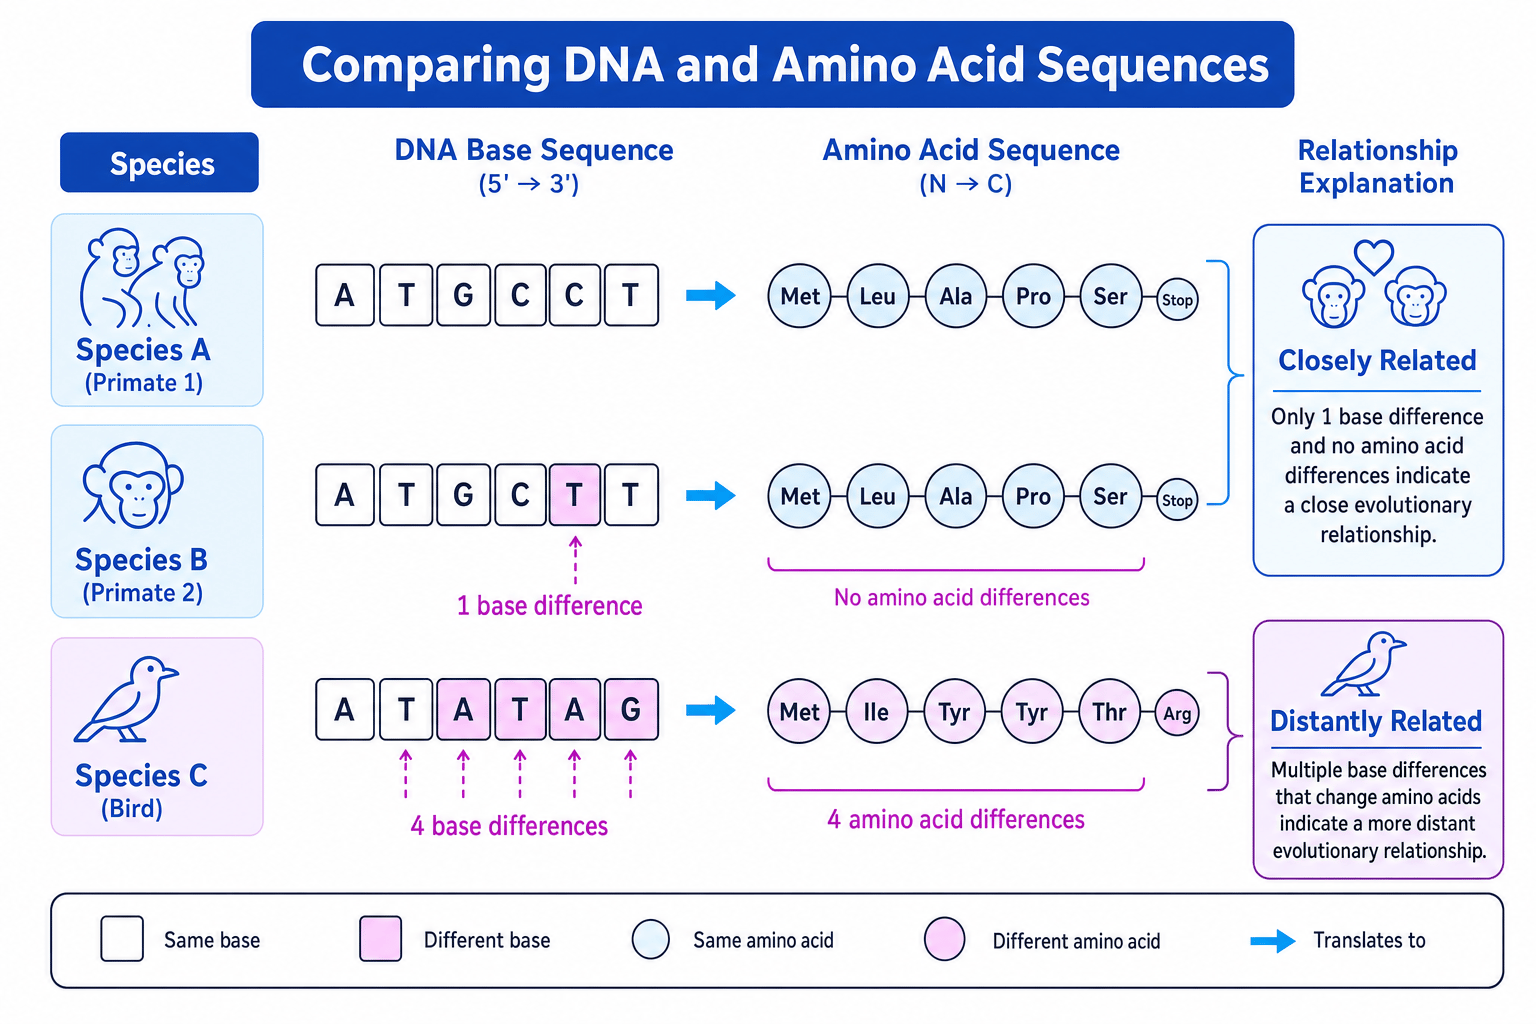
When one species gives rise to another during evolution, the genome of the new species will initially be very similar to the original. Over time, mutations occur. The more time that passes since two species shared a common ancestor, the more mutations will build up in their DNA.
Evolutionary relationships
Closely related species have very similar DNA base sequences. Distantly related species have accumulated more mutations over time, resulting in more differences in their DNA, mRNA, and amino acid sequences.
- DNA base sequence: This is the most accurate method. By reading the exact order of
A,T,C, andG, scientists can count the exact number of base differences between two organisms. - mRNA base sequence: Because mRNA is transcribed directly from DNA, comparing mRNA sequences also provides an excellent measure of diversity.
- Amino acid sequence: You can compare the sequence of amino acids in a specific protein (like haemoglobin or cytochrome c) that is shared between the organisms.
The degenerate code
Remember that the genetic code is degenerate (multiple triplet codes can code for the same amino acid). This means a mutation can change the DNA base sequence without changing the amino acid sequence. Therefore, comparing DNA base sequences is always more sensitive and accurate than comparing amino acid sequences.
Quantitative Investigations of Variation
When investigating variation within a single species, biologists usually measure quantitative (numerical) characteristics, like the length of leaves on an oak tree or the mass of mice in a field.
It is practically impossible to measure every single individual in a population. Instead, we have to take a sample. To ensure your sample data accurately represents the whole population, it must be collected randomly.
Taking a random sample
If you choose which leaves to measure yourself, you might naturally pick the largest ones, or the ones easiest to reach. This introduces bias. To eliminate human bias, we use a random sampling method.
A standard method for random sampling in a field involves:
- Laying out two long tape measures at right angles to create a grid over the area.
- Using a random number generator (on a calculator or computer) to generate two coordinates.
- Placing a quadrat exactly at those coordinates and collecting the data.
Analyzing Quantitative Data
Once you have collected your random sample, you will have a large set of numbers. To make sense of them, you need to calculate two vital statistics.
The Mean
The mean is the average value. You calculate it by adding up all your measured values and dividing by the total number of measurements taken. The mean is useful for comparing the average sizes of two different populations, but it doesn't tell you anything about how spread out the data is.
Standard Deviation
Standard deviation tells you about the spread of values around the mean.
- A small standard deviation means most of the data points are clustered closely around the mean. The data is highly reliable.
- A large standard deviation means the data points are spread widely around the mean. There is a lot of variation in the sample.
Calculating Standard Deviation
You will not be asked to calculate the standard deviation from scratch in your written A-Level exams. However, you will be expected to know what it means and how to interpret it when given the value.
Interpreting overlap
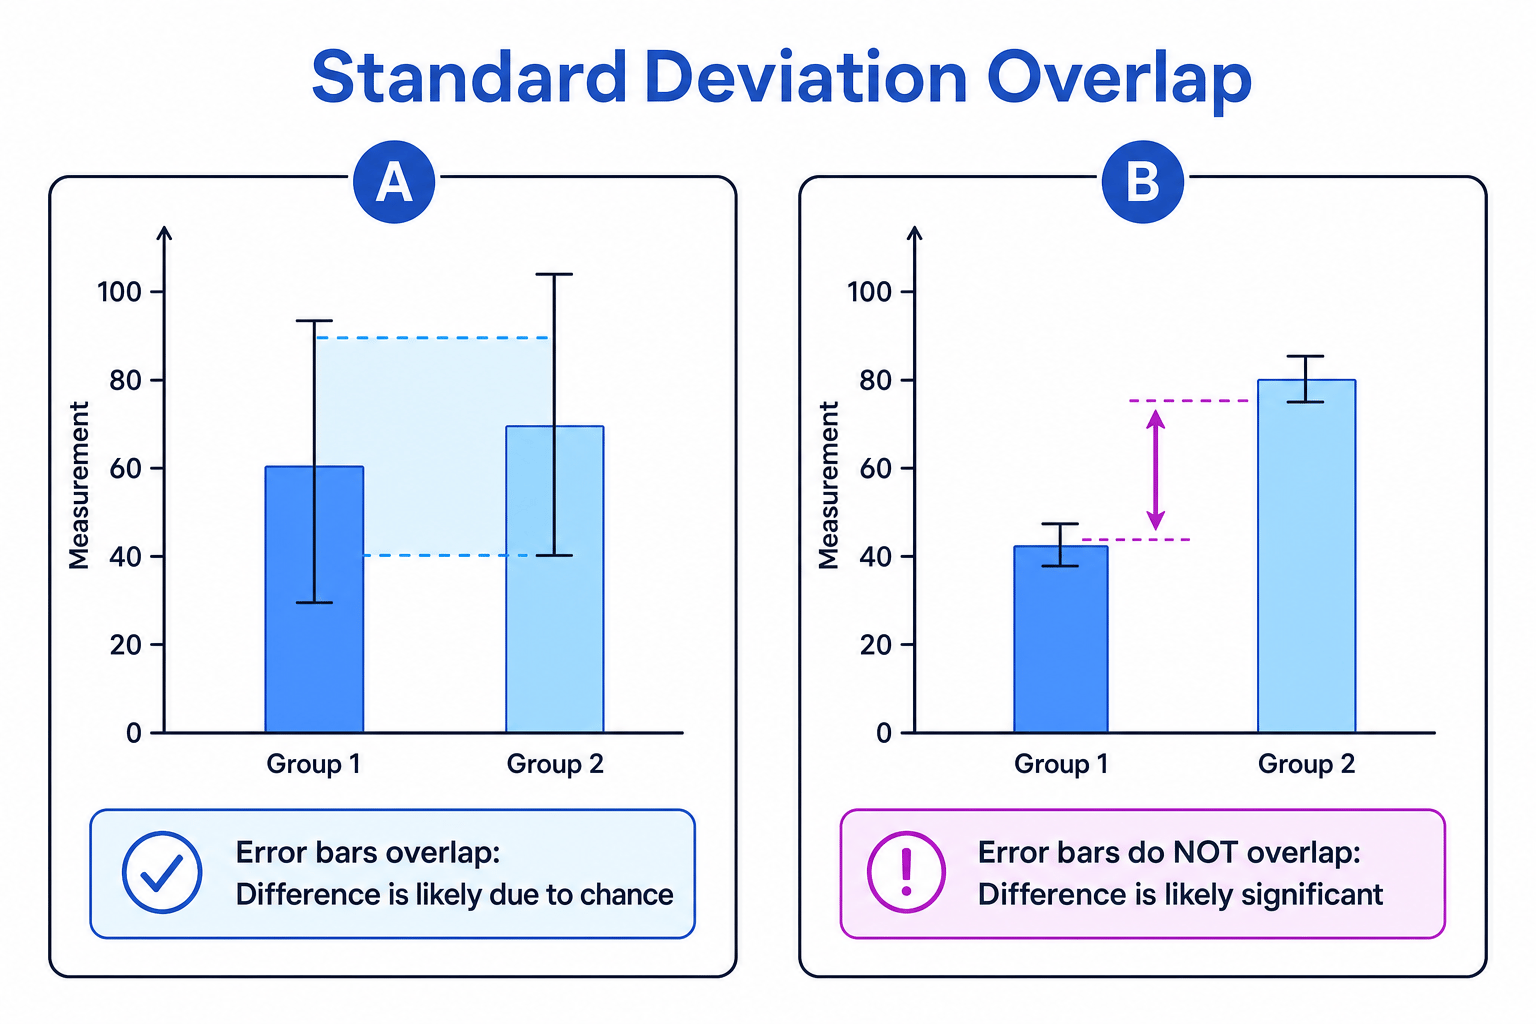
In the exam, you will frequently be given a bar chart or a table showing the means of two groups along with their standard deviations. You need to check if the standard deviations of the two groups overlap.
Confusing chance and significance
A very common mistake is stating "the results are significant" without explaining why. Always link your conclusion back to the standard deviation overlap and the concept of chance.
Interpreting standard deviation data
A student investigated the variation in leaf length between two different populations of plants.
- Population A had a mean leaf length of 45.245.245.2 mm with a standard deviation of 3.13.13.1 mm.
- Population B had a mean leaf length of 52.052.052.0 mm with a standard deviation of 2.82.82.8 mm. Based on this data, is the difference in mean leaf length likely to be significant?
- Calculate the spread (Mean±SD\text{Mean} \pm \text{SD}Mean±SD) for Population A.
The standard deviation range for Population A is 42.1 mm42.1 \text{ mm}42.1 mm to 48.3 mm48.3 \text{ mm}48.3 mm.
- Calculate the spread (Mean±SD\text{Mean} \pm \text{SD}Mean±SD) for Population B.
The standard deviation range for Population B is 49.2 mm49.2 \text{ mm}49.2 mm to 54.8 mm54.8 \text{ mm}54.8 mm.
-
Compare the ranges to check for overlap. The highest value in Population A's spread (48.3 mm48.3 \text{ mm}48.3 mm) is lower than the lowest value in Population B's spread (49.2 mm49.2 \text{ mm}49.2 mm). The ranges do not cross over.
-
State your conclusion. Because the standard deviations do not overlap, the difference in the mean leaf lengths is likely to be significant (it is unlikely to be due to chance).
In the exam
When answering questions about molecular phylogeny or statistical interpretation, keep these key phrases ready:
- Comparing sequences: State that "more similar DNA/amino acid sequences indicate a more recent common ancestor".
- Avoiding bias: If asked how to ensure a sample is valid, write "use a random number generator to select coordinates" rather than just saying "choose randomly".
- Statistical conclusions: If SDs overlap, write: "The standard deviations overlap, so the difference between the means is likely due to chance and is not significant."
- If SDs do NOT overlap, write: "The standard deviations do not overlap, so the difference between the means is likely significant and not due to chance."
Check yourself
- Why is comparing DNA base sequences a more accurate measure of genetic diversity than comparing observable characteristics?
- Why might two species have identical amino acid sequences for a specific protein, but slightly different DNA base sequences for the gene encoding it?
- Describe exactly how you would position a quadrat randomly in a field to avoid bias.
- If Population X has a mean of 151515 and an SD of 444, and Population Y has a mean of 202020 and an SD of 555, do their standard deviations overlap? What does this tell you about the difference in their means?
