Shape of the PPC
Definition
Opportunity cost: the next best alternative forgone when a choice is made, shown on a PPC by how much of one good is sacrificed to gain more of the other and measured by the slope of the curve.
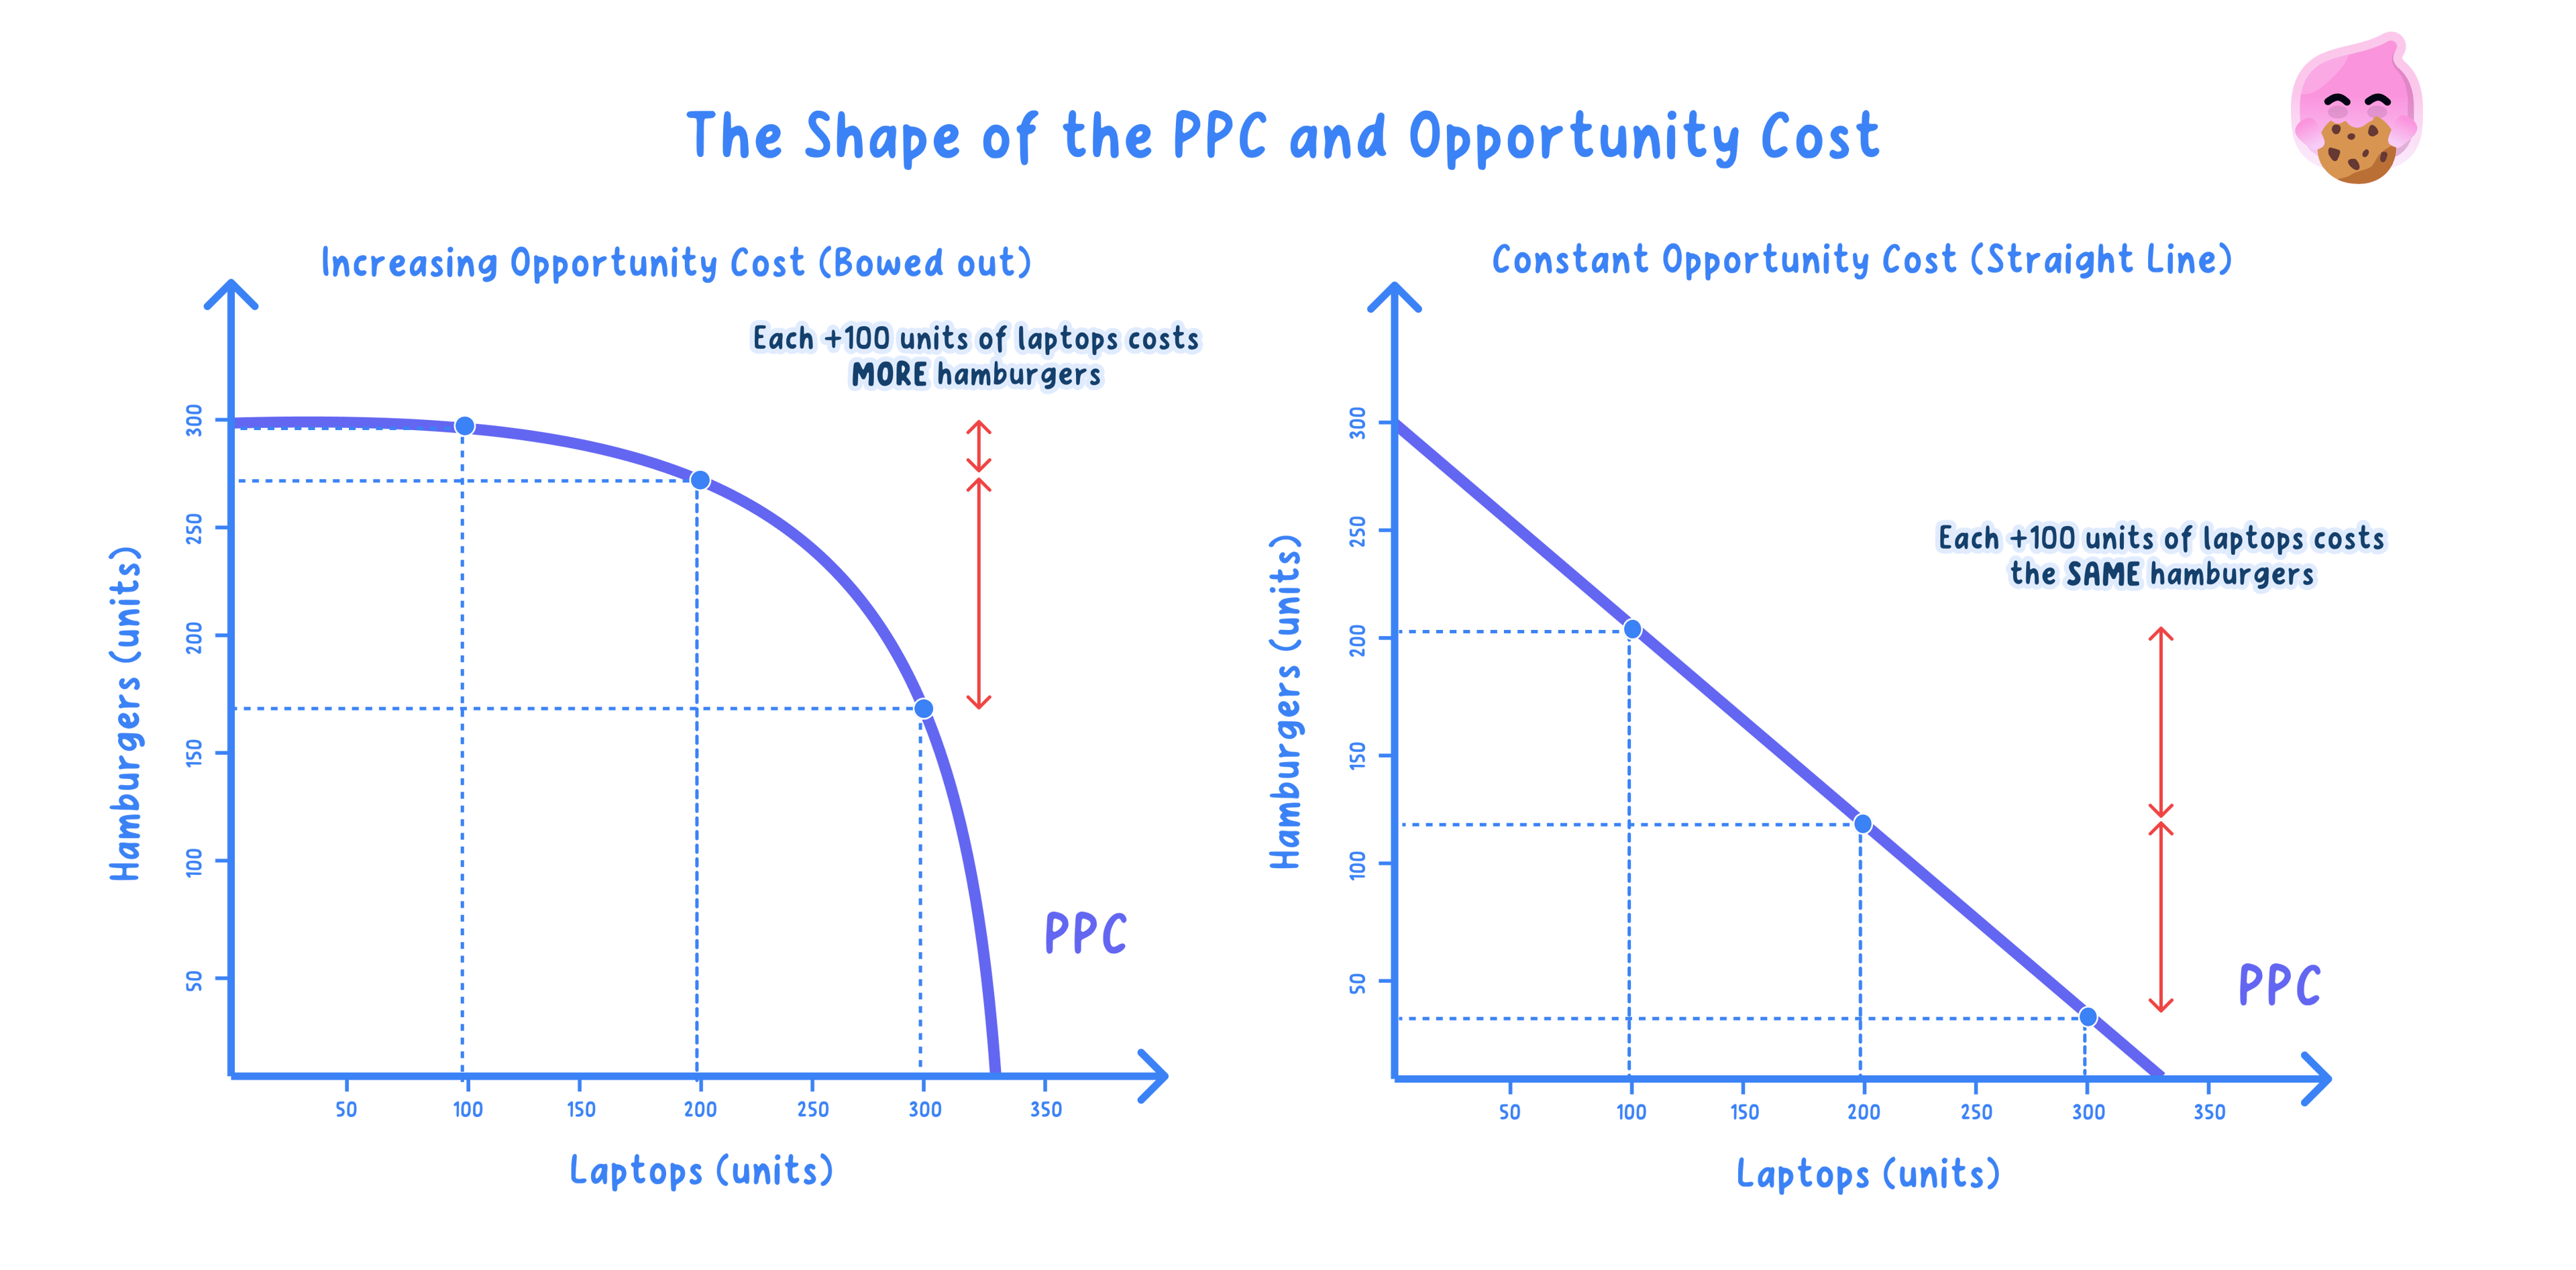
- The shape of a PPC depends on how opportunity cost changes as production is switched between the two goods.
- A straight-line PPC shows constant opportunity cost, while a bowed-out PPC shows increasing opportunity cost.
- The difference comes from how easily resources can be moved from making one good to making the other: if they switch freely the cost stays flat, but if they are specialised the cost rises.
Key Idea
- A straight line means every extra unit of one good costs the same amount of the other good.
- A curve bowed outwards from the origin means each extra unit costs more of the other good than the last.
- This rising sacrifice is what is meant by increasing opportunity cost.
Constant opportunity cost
- Constant opportunity cost arises when resources are equally suited to producing either good.
- Switching resources from one good to the other then always sacrifices the same amount, because no resource is any better at one task than the other.
- Because the sacrifice never changes, the PPC is a straight line with a constant slope.
Example
- Suppose an economy gives up 10 units of good Y for every 5 units of good X it gains, at every point.
- Moving from 0 to 5 units of X costs 10 units of Y.
- Moving from 5 to 10 units of X costs another 10 units of Y.
- So each unit of X costs 2 units of Y throughout.
- Because the cost per unit never changes, the PPC is a straight line.
Increasing opportunity cost
- Increasing opportunity cost arises because resources are not equally suited to producing both goods.
- As output of one good rises, ever less suitable resources must be switched across, so more of the other good is sacrificed each time.
- The rising sacrifice makes the PPC bow outwards from the origin.
Example
- Suppose the economy produces wheat and cars and starts with all resources on wheat.
- The first 10 cars cost only 5 units of wheat, because the first resources moved (engineers, city land) are well suited to car making.
- The next 10 cars cost 15 units of wheat, as fertile farmland and farm workers, poorly suited to cars, must now be switched.
- The rising cost per batch (+5 then +15) bows the curve outwards, showing increasing opportunity cost.
Why bowing is normal
- In the real world factors of production are specialised, so they are rarely equally good at making every product.
- This specialisation makes increasing opportunity cost, and so the bowed curve, the usual case.
- The straight-line PPC is a simpler special case used to isolate the idea of constant cost; whether it applies depends on how interchangeable the resources really are.
Note
- The steeper the curve becomes, the higher the opportunity cost of the good on the horizontal axis.
- A straight line is realistic only when resources are perfectly interchangeable between the two goods.
- In practice this rarely holds, so the bowed shape is drawn by default.
Exam technique
- Draw a bowed-out curve when opportunity cost increases and a straight line when it is constant.
- Read the slope to state how much of one good is given up for the other.
- Support any claim about the shape with the behaviour of the resources behind it.
Common Mistake
- Do not assume every PPC is a straight line.
- Increasing opportunity cost, and so a bowed curve, is the normal case.
- Do not describe the slope as the price of a good.
- The slope shows opportunity cost measured in units of the other good.
Self review
- What shape of PPC shows constant opportunity cost, and why?
- What shape shows increasing opportunity cost, and why?
- How does resource suitability explain the bowed-out shape?
- Using numbers, show what increasing opportunity cost looks like.
- What does the slope of the PPC measure?
