Reading the Shape of a PPC
Reading the Shape of a PPC
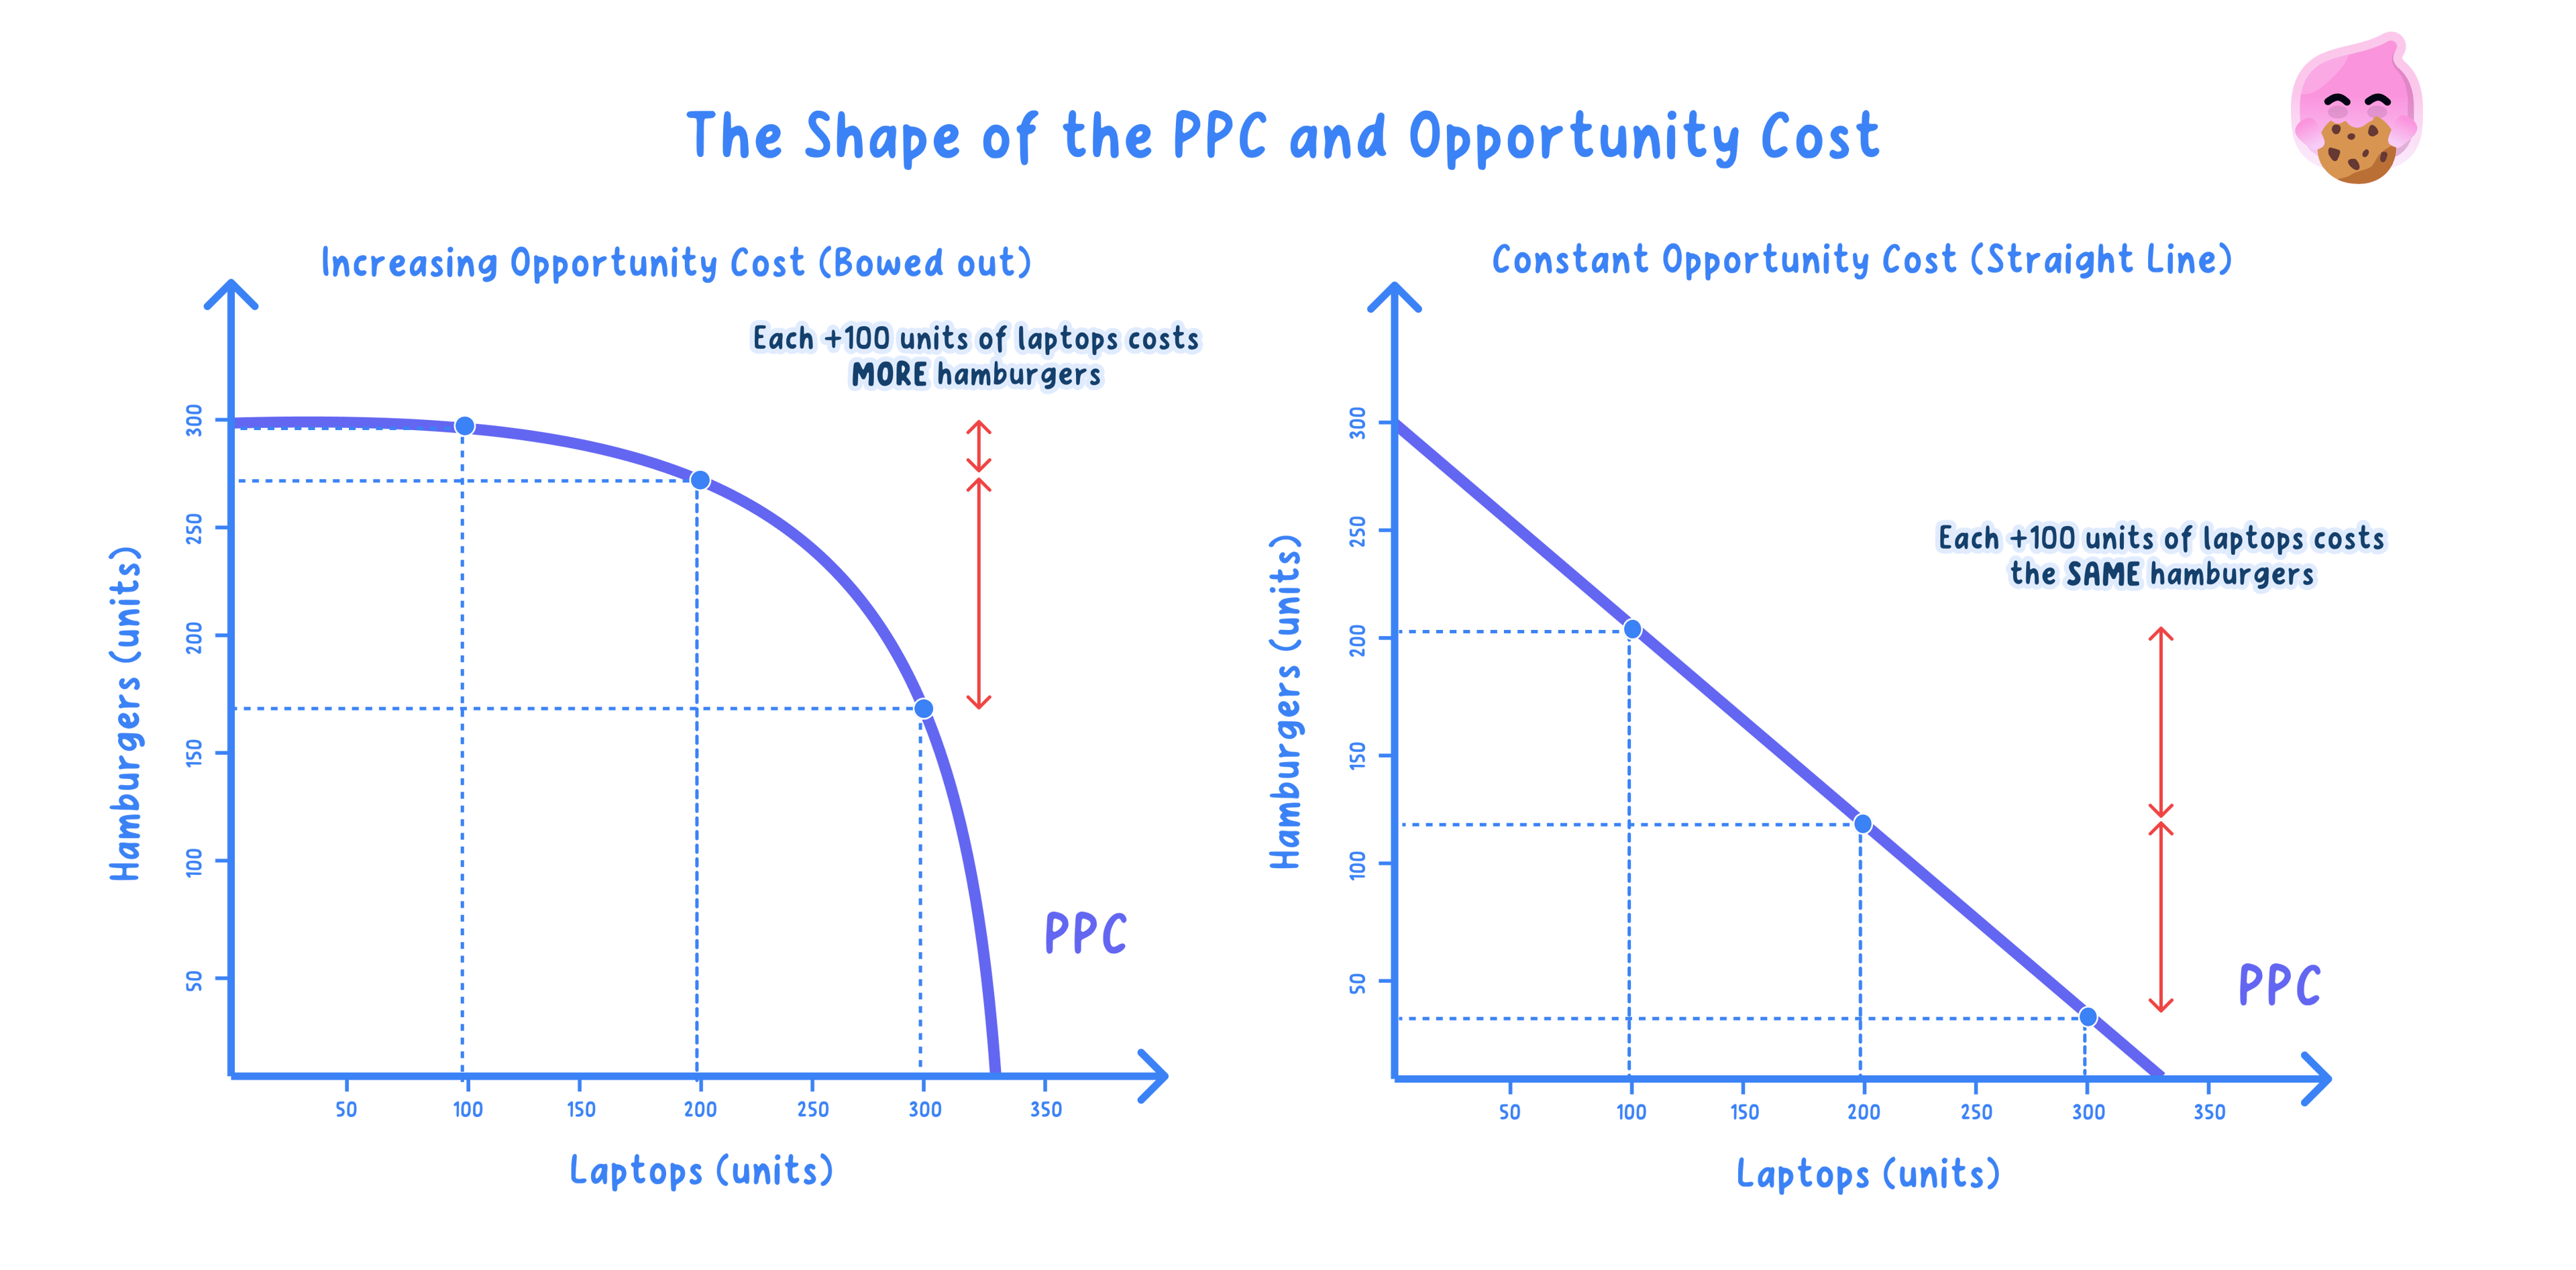
A production possibility curve, or PPC, shows the maximum combinations of two goods an economy can produce using its available resources efficiently. Its downward slope represents a trade-off: producing more of one good requires giving up some of the other.
1.5.2 shape of the PPC: constant and increasing opportunity costs Lesson
Step-by-step lessons on CIE Intl A Level Economics 1.5.2 shape of the PPC: constant and increasing opportunity costs. Each one builds up to exam-style questions.