Production Possibility Curve
Definition
Production possibility curve (PPC): a curve showing the maximum combinations of two goods an economy can produce when all its resources and technology are used fully and efficiently.
- An economy has a limited stock of resources, so it cannot produce unlimited quantities of every good at once; something must always be given up to gain more of anything else.
- Placing one good on each axis, the curve traces the outer boundary of every output combination those resources can just achieve when nothing is wasted.
- Each point on the boundary is a different mix of the two goods produced when resources are fully employed, so choosing one point means rejecting all the others.
- The model turns the ideas of scarcity, choice and opportunity cost into a single picture: because resources are scarce, a choice must be made, and every choice carries a cost measured in the alternative forgone.
Key Idea
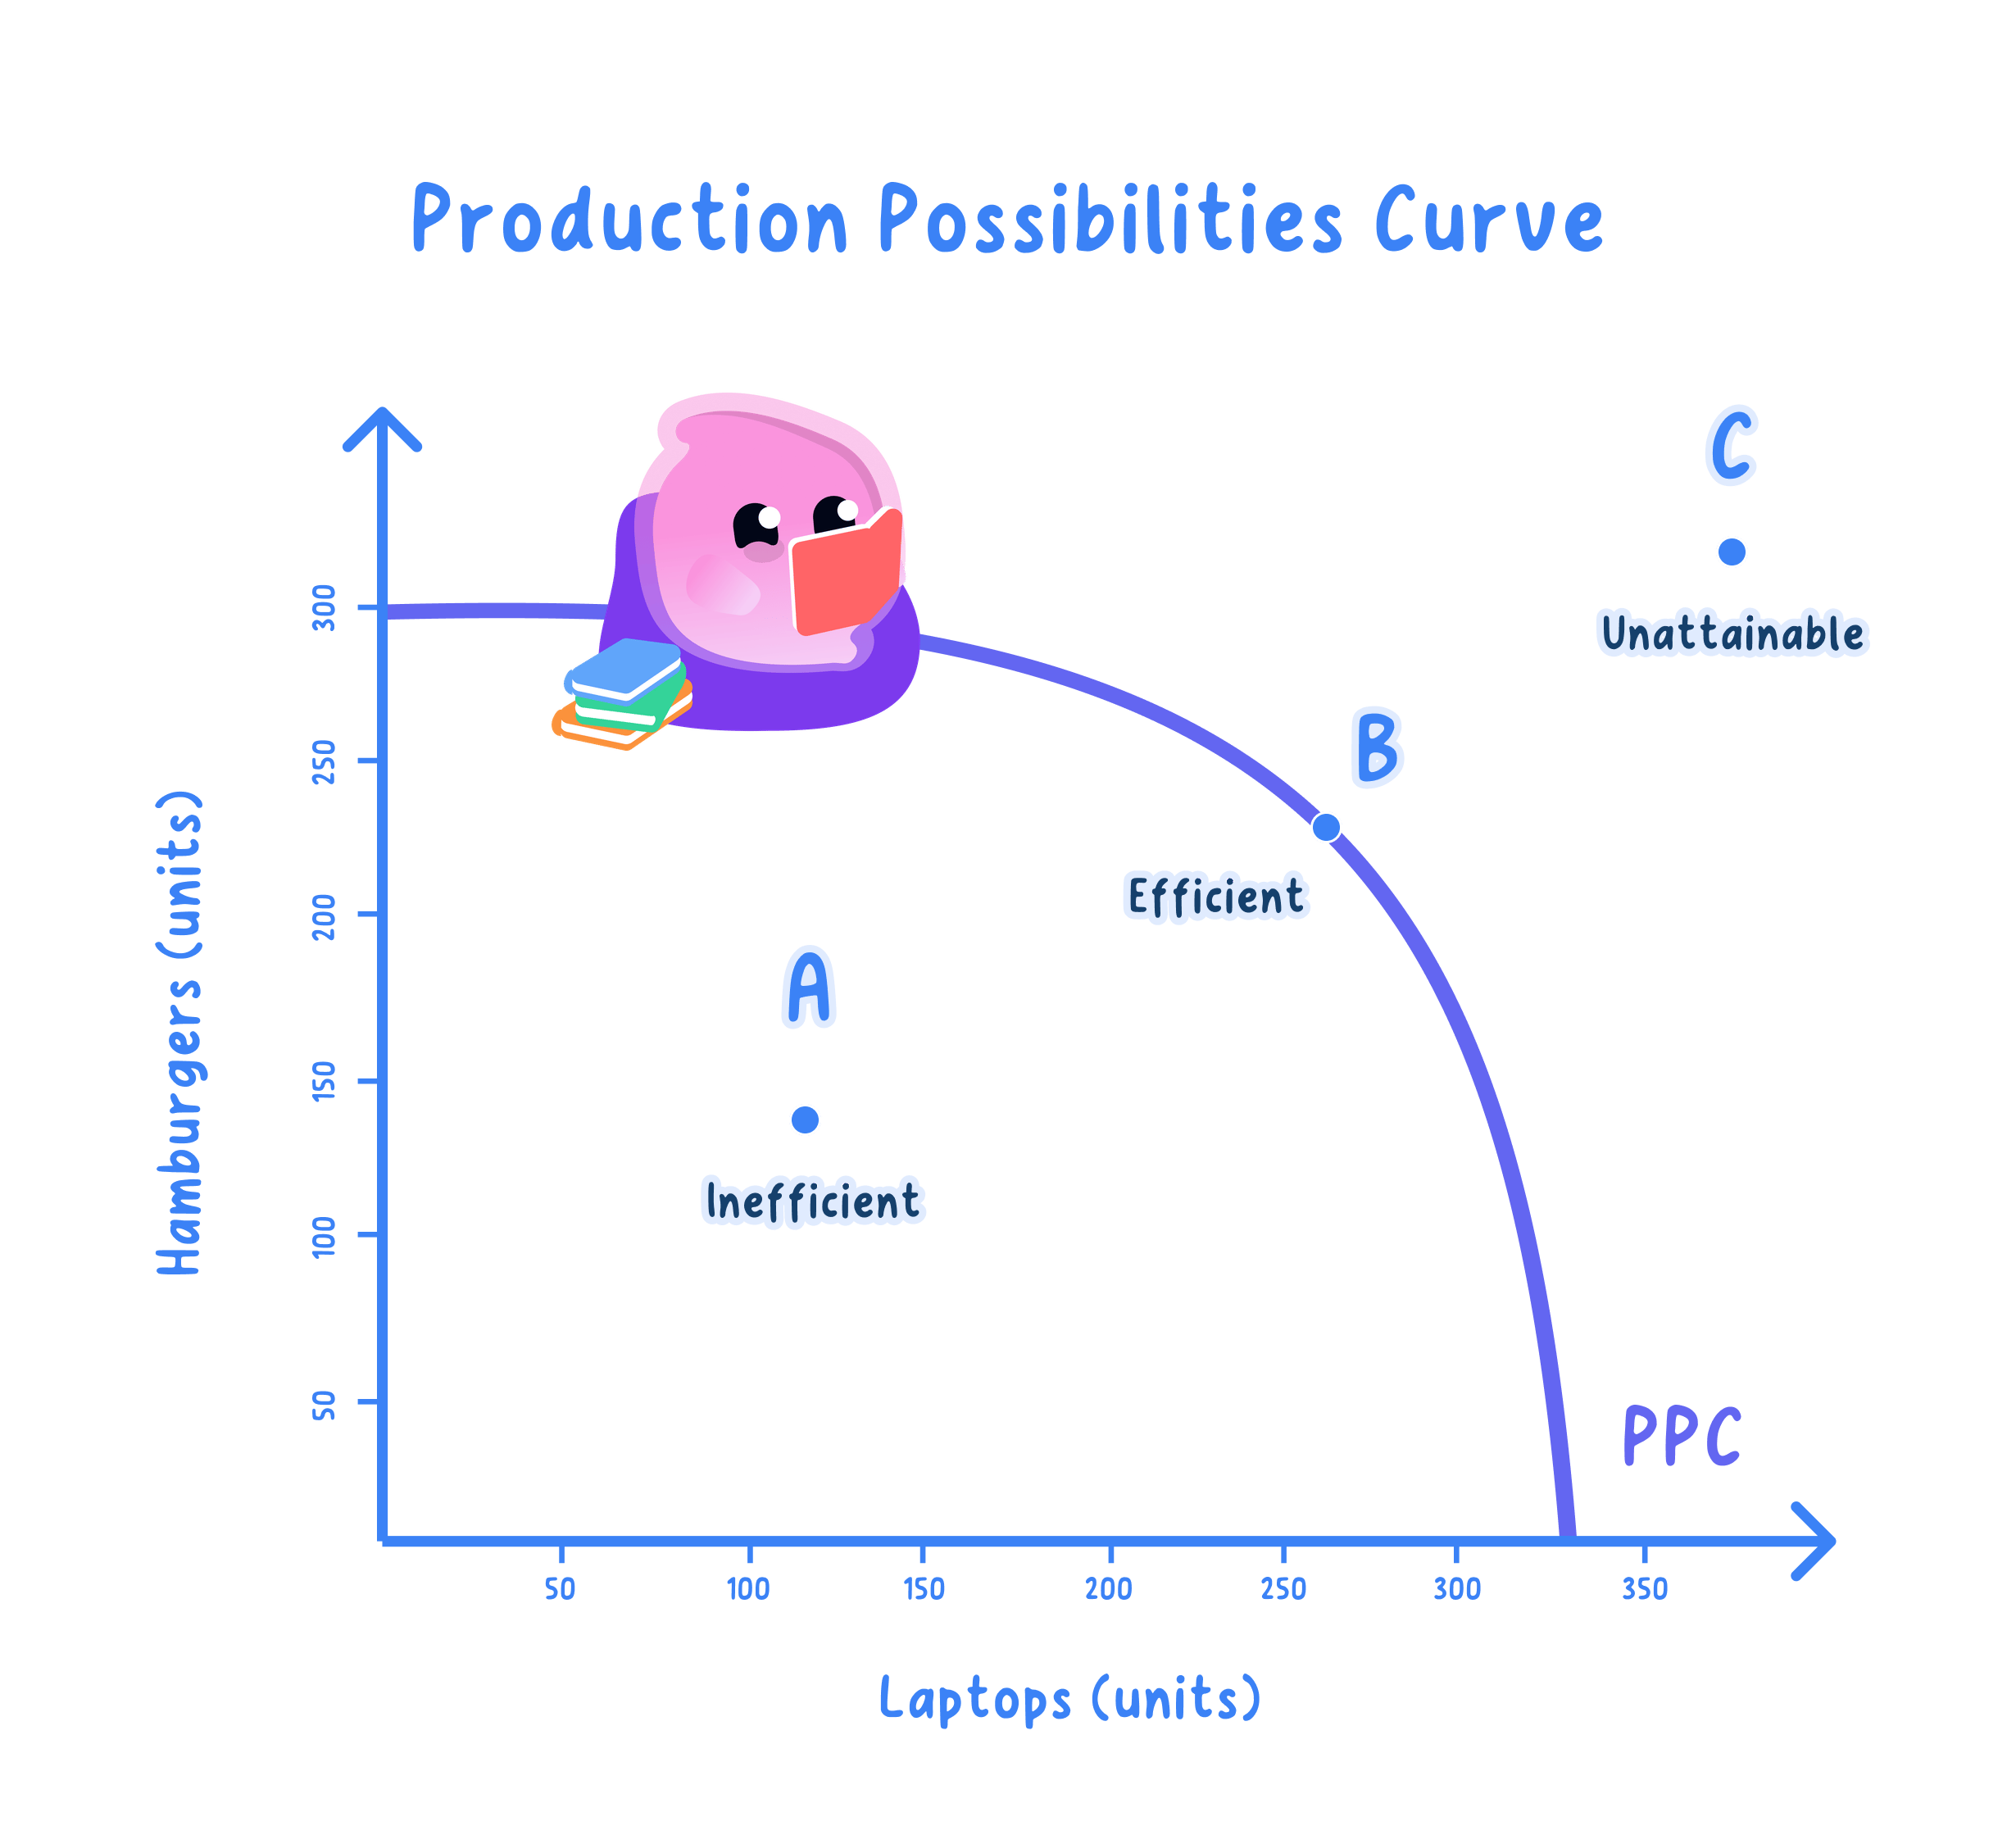
- A point on the curve uses all resources fully, so more of one good can be made only by making less of the other.
- A point inside the curve is attainable but leaves resources idle through spare capacity or unemployment.
- A point beyond the curve is currently unattainable with today's resources and technology.
Uses of the model
- It makes the opportunity cost of any output decision visible as the amount of the other good forgone.
- It separates an economy running at full capacity from one leaving resources unused, and so signals whether the priority is efficiency or recovery.
- It captures a real trade-off with capital and consumer goods on the axes: choosing more capital goods now means fewer consumer goods today, but the extra machinery raises future capacity and shifts the whole curve outward later, so it depends on whether a society values present or future consumption more.
Note
- A point beyond the curve is not merely inefficient; it cannot be reached at all today.
- Reaching it requires economic growth, which shifts the entire curve outward.
Limitations
- The model simplifies a whole economy down to just two goods.
- It shows productive potential but not whether the mix chosen is the one society most wants, so a point on the curve can still be the wrong point.
- Even so, its value is making the abstract idea of opportunity cost visible at a glance.
Exam technique
- Label each axis with one of the two goods, never with price and quantity.
- State clearly whether a point lies on the curve, inside it or beyond it before analysing it.
- Use a movement along the curve, not a shift, to demonstrate opportunity cost.
Common Mistake
- Do not treat a point beyond the curve as merely inefficient.
- It is unattainable with current resources and technology.
- Do not confuse a movement along the PPC with a shift of the whole curve.
- Moving along reallocates resources, while a shift changes total capacity.
Self review
- What does a production possibility curve show?
- What does a point on, inside and beyond the curve each represent?
- How does a movement along the curve illustrate opportunity cost?
- Why is a point beyond the curve unattainable today?
- Give one limitation of the PPC model.
