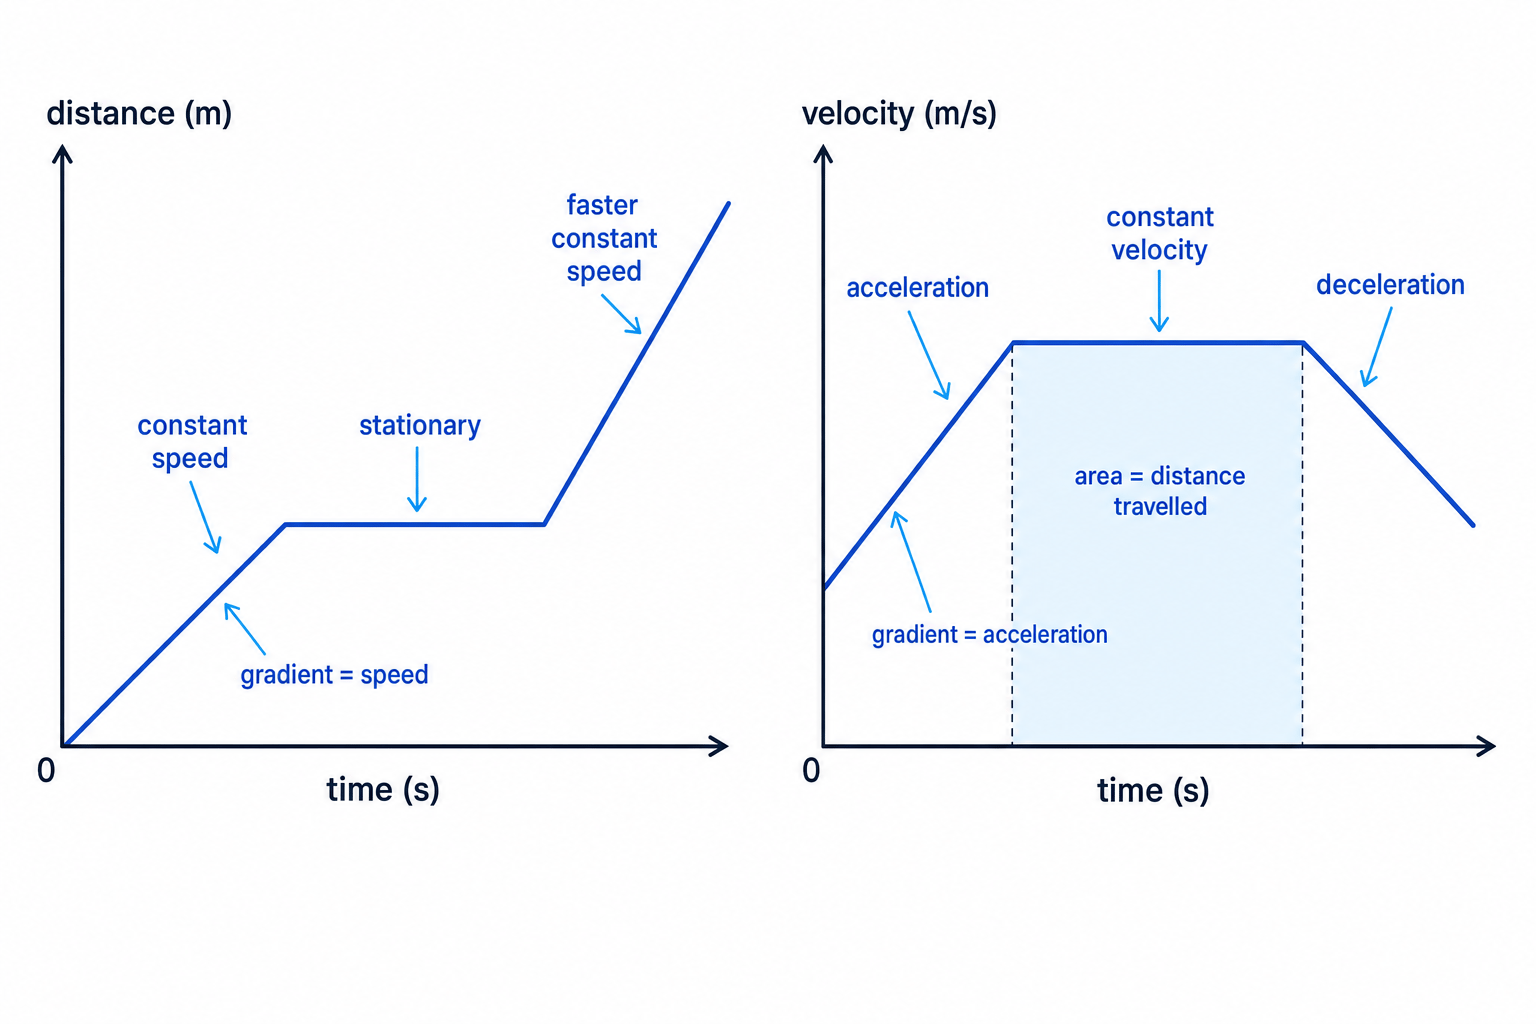
What you'll learn
- How distance, speed, velocity and acceleration describe motion.
- How to plot and interpret distance–time graphs and velocity–time graphs.
- How to calculate speed, acceleration, distance from graph area, and final speed.
- How the named practical on motion of everyday objects is carried out.
The basic quantities
In this topic, you describe how an object’s position changes over time. You do not need advanced maths: the key skills are choosing the right equation, reading graph gradients, and using units carefully.
Distance, speed and velocity
Distance moved is how far an object travels in total, measured in m or km. Speed is how fast distance is covered, measured in m/s. Velocity is speed in a stated direction, also measured in m/s.
The symbol sss is often used for distance moved. This is easy to confuse with the unit s, meaning seconds, so always look at the context.
Average speed
If an object changes speed during a journey, we often calculate its average speed over the whole journey.
The spec relationship is:
- average speed = distance moved / time taken
- v=stv = \frac{s}{t}v=ts
where vvv is average speed in m/s, sss is distance moved in m, and ttt is time taken in s.
Useful rearrangements are:
s=v×tt=svs = v \times t \qquad t = \frac{s}{v}s=v×tt=vsCalculating average speed
A toy car travels 1.20 m in 2.4 s. Find its average speed.
- Identify the known values: s=1.20 ms = 1.20\ \text{m}s=1.20 m and t=2.4 st = 2.4\ \text{s}t=2.4 s.
- Substitute into the equation: v=st=1.20 m2.4 sv = \frac{s}{t} = \frac{1.20\ \text{m}}{2.4\ \text{s}}v=ts=2.4 s1.20 m.
- Calculate with units: v=0.50 m/sv = 0.50\ \text{m/s}v=0.50 m/s.
Distance–time graphs
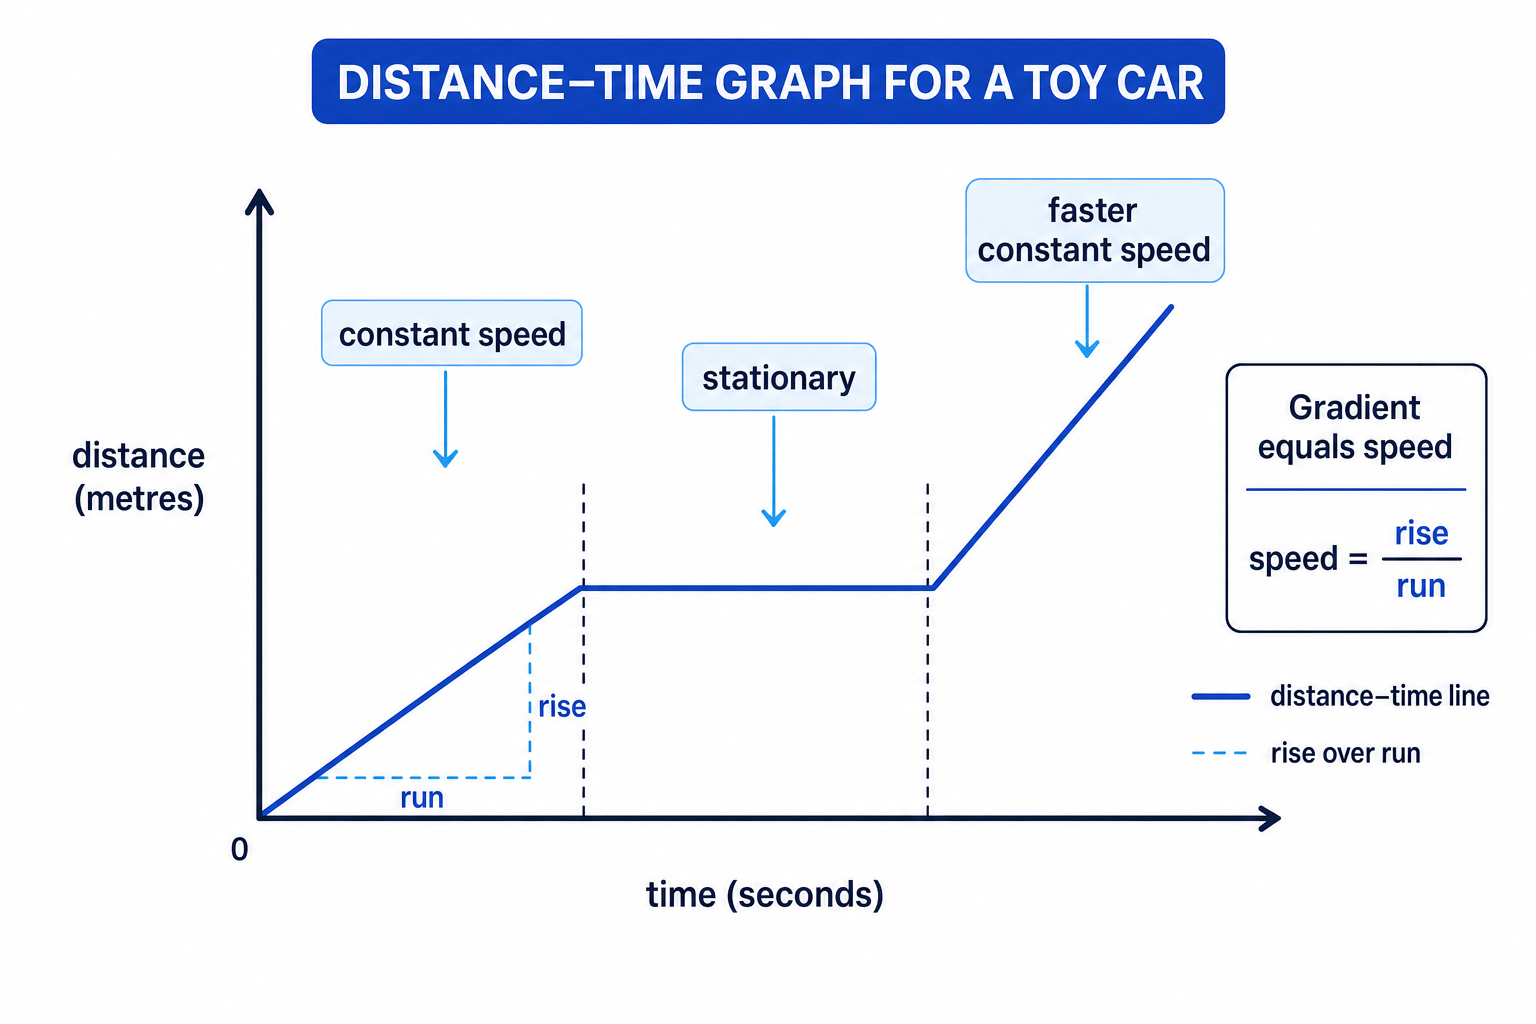
A distance–time graph shows how far an object has moved as time passes. Time goes on the horizontal axis, and distance goes on the vertical axis.
The gradient of a graph means its steepness. On a distance–time graph:
- a straight sloping line means constant speed
- a steeper line means a greater speed
- a horizontal line means the object is stationary
- a curve means the speed is changing
Distance–time graph rule
On a distance–time graph, gradient = speed. For a straight section, calculate gradient using change in distancechange in time\frac{\text{change in distance}}{\text{change in time}}change in timechange in distance.
Finding speed from a distance–time graph
A straight section of a distance–time graph goes from 8 m at 4 s to 32 m at 10 s. Find the speed.
- Find the change in distance: Δs=32 m−8 m=24 m\Delta s = 32\ \text{m} - 8\ \text{m} = 24\ \text{m}Δs=32 m−8 m=24 m.
- Find the change in time: Δt=10 s−4 s=6 s\Delta t = 10\ \text{s} - 4\ \text{s} = 6\ \text{s}Δt=10 s−4 s=6 s.
- Use gradient = speed: v=24 m6 s=4.0 m/sv = \frac{24\ \text{m}}{6\ \text{s}} = 4.0\ \text{m/s}v=6 s24 m=4.0 m/s.
Mixing up graph readings
The final distance on a distance–time graph is not the speed. Speed comes from the gradient of the graph.
Practical: investigating motion of everyday objects
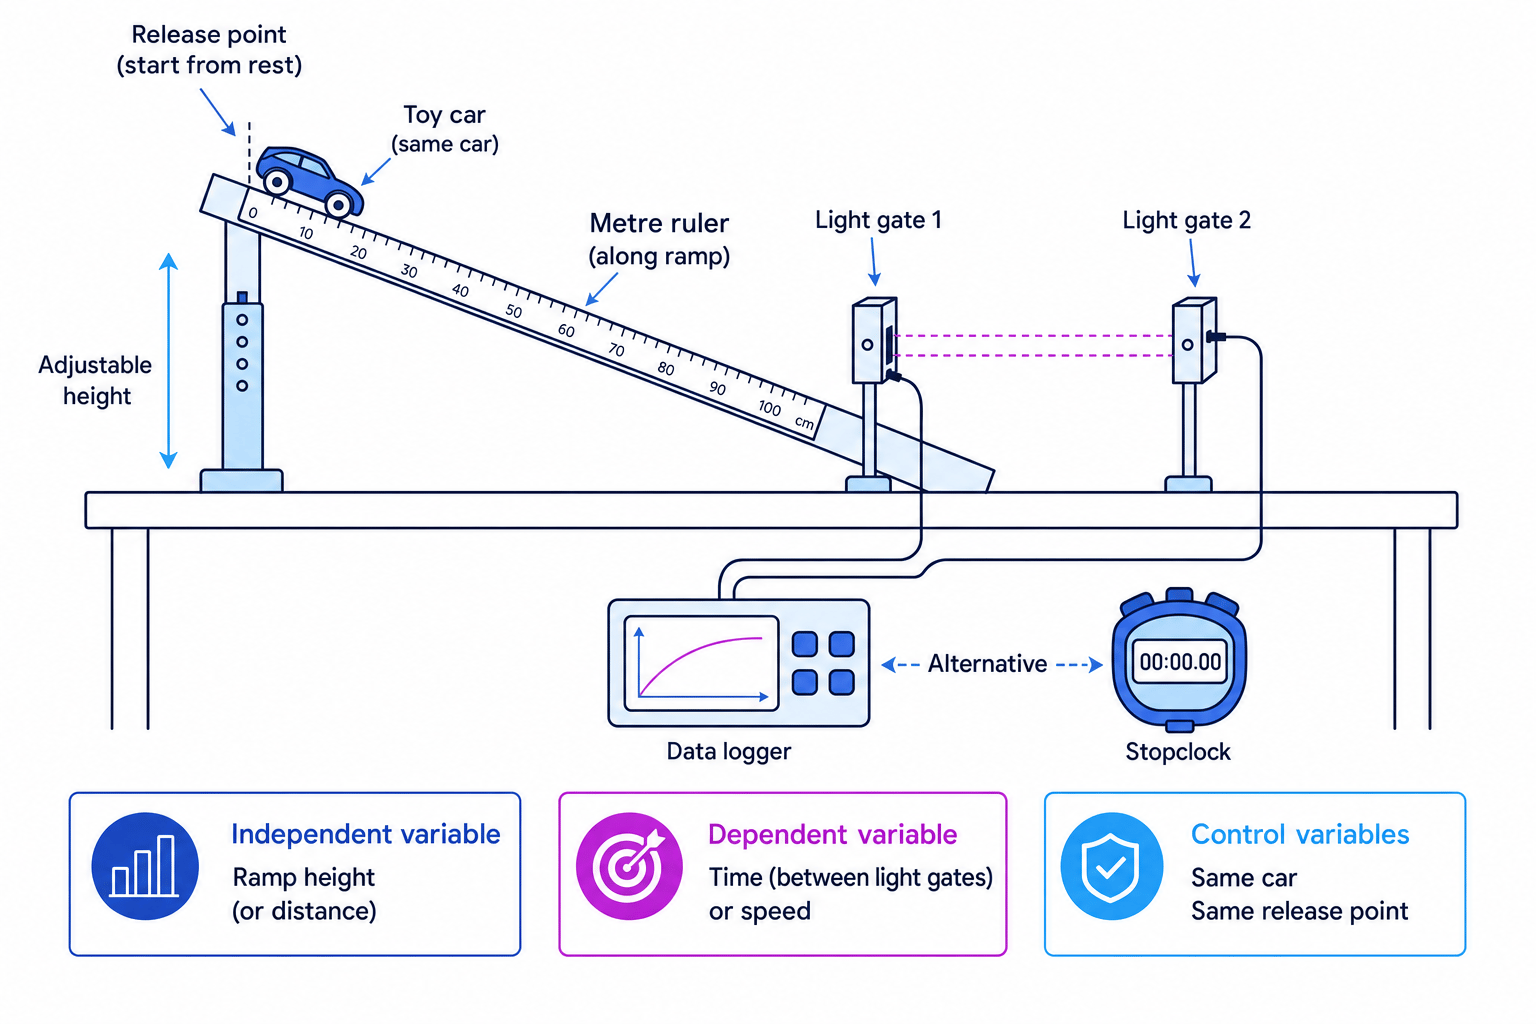
This named practical may use a toy car, trolley, tennis ball, ramp, metre ruler, stopclock, light gates, or a data logger. In the written exam, you may be asked about the method, variables, graph, or errors.
Method using a toy car and ramp
- Set up a ramp and measure a known distance along it using a metre ruler.
- Release the toy car from rest, without pushing it.
- Measure the time taken to travel the distance, using light gates or a stopclock.
- Repeat at least three times and calculate a mean time.
- Use v=stv = \frac{s}{t}v=ts to calculate average speed.
Variables
- Independent variable: the distance travelled, or the ramp height if you are testing how ramp steepness affects motion.
- Dependent variable: time taken or calculated speed.
- Control variables: same toy car, same release point, same ramp surface, and same method of release.
Graphing results
If you measure distance and time, plot a distance–time graph. The gradient gives speed. If you use light gates or video analysis to find velocity at different times, plot a velocity–time graph. The gradient then gives acceleration.
Using repeated timings
A toy car travels 1.00 m. The times recorded are 1.48 s, 1.52 s and 1.50 s.
- Calculate the mean time: t=1.48 s+1.52 s+1.50 s3=1.50 st = \frac{1.48\ \text{s} + 1.52\ \text{s} + 1.50\ \text{s}}{3} = 1.50\ \text{s}t=31.48 s+1.52 s+1.50 s=1.50 s.
- Calculate average speed: v=1.00 m1.50 s=0.67 m/sv = \frac{1.00\ \text{m}}{1.50\ \text{s}} = 0.67\ \text{m/s}v=1.50 s1.00 m=0.67 m/s.
- Judge reliability: the readings are close together, so the mean is likely to be reliable.
Improving the practical
Light gates reduce reaction-time error compared with using a stopclock. If you use manual timing, repeat readings and calculate a mean.
Acceleration
Acceleration is how quickly velocity changes. It is measured in m/s². If an object speeds up in the chosen direction, acceleration is positive. If it slows down, acceleration may be negative; this is often called deceleration.
The spec relationship is:
- acceleration = change in velocity / time taken
- a=(v−u)ta = \frac{(v - u)}{t}a=t(v−u)
where uuu is initial velocity, vvv is final velocity, ttt is time taken, and aaa is acceleration.
Useful rearrangements are:
v=u+(a×t)t=(v−u)av = u + (a \times t) \qquad t = \frac{(v-u)}{a}v=u+(a×t)t=a(v−u)Calculating acceleration
A car increases its velocity from 3.0 m/s to 15.0 m/s in 4.0 s. Find its acceleration.
- Find the change in velocity: v−u=15.0 m/s−3.0 m/s=12.0 m/sv-u = 15.0\ \text{m/s} - 3.0\ \text{m/s} = 12.0\ \text{m/s}v−u=15.0 m/s−3.0 m/s=12.0 m/s.
- Substitute into the equation: a=(v−u)t=12.0 m/s4.0 sa = \frac{(v-u)}{t} = \frac{12.0\ \text{m/s}}{4.0\ \text{s}}a=t(v−u)=4.0 s12.0 m/s.
- Calculate with units: a=3.0 m/s2a = 3.0\ \text{m/s}^2a=3.0 m/s2.
Forgetting the initial velocity
Do not calculate acceleration using final velocity divided by time unless the object started from rest. Use the change in velocity.
Velocity–time graphs
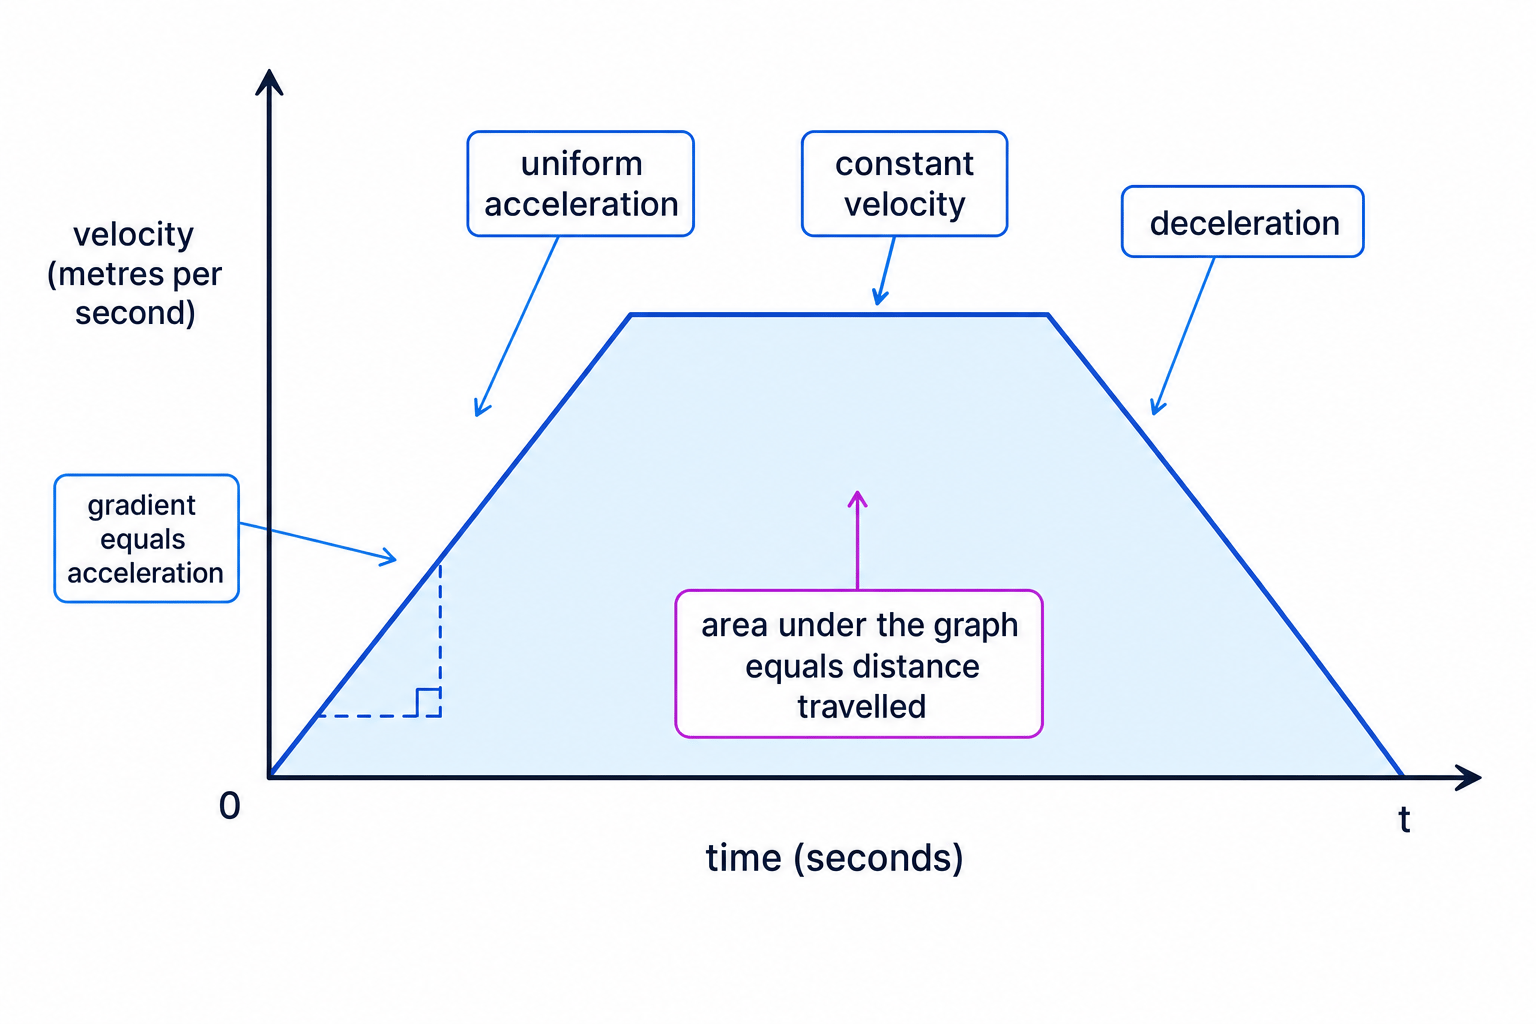
A velocity–time graph shows how velocity changes with time. Time goes on the horizontal axis, and velocity goes on the vertical axis.
On a velocity–time graph:
- a horizontal line means constant velocity
- an upward sloping line means acceleration
- a downward sloping line means deceleration
- a steeper gradient means a larger acceleration
Velocity–time graph rules
On a velocity–time graph, gradient = acceleration and the area between the graph and the time axis = distance travelled.
Finding acceleration from a velocity–time graph
A straight section of a velocity–time graph goes from 4 m/s at 2 s to 16 m/s at 8 s. Find the acceleration.
- Find the change in velocity: Δv=16 m/s−4 m/s=12 m/s\Delta v = 16\ \text{m/s} - 4\ \text{m/s} = 12\ \text{m/s}Δv=16 m/s−4 m/s=12 m/s.
- Find the change in time: Δt=8 s−2 s=6 s\Delta t = 8\ \text{s} - 2\ \text{s} = 6\ \text{s}Δt=8 s−2 s=6 s.
- Use gradient = acceleration: a=12 m/s6 s=2.0 m/s2a = \frac{12\ \text{m/s}}{6\ \text{s}} = 2.0\ \text{m/s}^2a=6 s12 m/s=2.0 m/s2.
Finding distance from a velocity–time graph
A car accelerates from 0 m/s to 8 m/s in 4 s, then travels at 8 m/s for another 6 s. Find the total distance travelled.
- Calculate the triangular area during acceleration: 12×4 s×8 m/s=16 m\frac{1}{2} \times 4\ \text{s} \times 8\ \text{m/s} = 16\ \text{m}21×4 s×8 m/s=16 m.
- Calculate the rectangular area during constant velocity: 6 s×8 m/s=48 m6\ \text{s} \times 8\ \text{m/s} = 48\ \text{m}6 s×8 m/s=48 m.
- Add the areas: 16 m+48 m=64 m16\ \text{m} + 48\ \text{m} = 64\ \text{m}16 m+48 m=64 m.
Final speed without time
Sometimes you know the distance moved but not the time taken. Then use this relationship:
- (final speed)^2 = (initial speed)^2 + (2 × acceleration × distance moved)
- v2=u2+(2×a×s)v^2 = u^2 + (2 \times a \times s)v2=u2+(2×a×s)
This is useful for motion with constant acceleration.
Useful rearrangements are:
s=v2−u22×aa=v2−u22×ss = \frac{v^2-u^2}{2 \times a} \qquad a = \frac{v^2-u^2}{2 \times s}s=2×av2−u2a=2×sv2−u2To find final speed:
v=u2+(2×a×s)v = \sqrt{u^2 + (2 \times a \times s)}v=u2+(2×a×s)Finding final speed without time
A cyclist starts from rest and accelerates at 2.0 m/s² over a distance of 25 m. Find the final speed.
- Identify the values: u=0 m/su = 0\ \text{m/s}u=0 m/s, a=2.0 m/s2a = 2.0\ \text{m/s}^2a=2.0 m/s2, and s=25 ms = 25\ \text{m}s=25 m.
- Substitute into the equation: v2=02+(2×2.0 m/s2×25 m)v^2 = 0^2 + (2 \times 2.0\ \text{m/s}^2 \times 25\ \text{m})v2=02+(2×2.0 m/s2×25 m).
- Calculate: v2=100 m2/s2v^2 = 100\ \text{m}^2\text{/s}^2v2=100 m2/s2, so v=100 m/s=10 m/sv = \sqrt{100}\ \text{m/s} = 10\ \text{m/s}v=100 m/s=10 m/s.
Only for constant acceleration
Use v2=u2+(2×a×s)v^2 = u^2 + (2 \times a \times s)v2=u2+(2×a×s) only when acceleration is constant. If an object is slowing down while moving forwards, acceleration should be negative.
In the exam
- Check the graph type: distance–time gradient gives speed; velocity–time gradient gives acceleration; velocity–time area gives distance.
- Write the equation before substituting numbers, and keep units in every calculation line.
- For graph gradients, choose two well-spaced points on the straight line, not two tiny points close together.
Check yourself
- What does a horizontal section mean on a distance–time graph?
- How would you find acceleration from a velocity–time graph?
- When would you choose v2=u2+(2×a×s)v^2 = u^2 + (2 \times a \times s)v2=u2+(2×a×s) instead of a=(v−u)ta = \frac{(v-u)}{t}a=t(v−u)?