

What you'll learn
- How development varies between countries and within countries.
- Why social, historic and economic factors create spatial differences in development.
- How uneven development affects welfare and quality of life in Brazil.
- How demographic data changes with development, including fertility, death rates and population structure.
1. Development is more than money
Development and human welfare
Development means improvement in people’s living conditions and life chances. It includes wealth, but also health, education, housing, safety, equality and access to services. Human welfare means people’s wellbeing: how secure, healthy and able to live a good life they are.
A country can have a high gross national income per person, often written as GNI per capita, but still have groups of people with poor housing or limited access to healthcare. That is why geographers also use indicators such as the Human Development Index, or HDI, which combines income, life expectancy and education into a score from 0 to 1.
Quality of life
Quality of life means the overall standard of a person’s life, including material things like income and housing, and non-material things like health, safety, education and freedom.
Big picture
Development is uneven because places do not all have the same opportunities, histories, resources, investment, infrastructure or access to services.
2. The global pattern of uneven development
Uneven development
Uneven development means that levels of wealth, services and wellbeing vary from place to place. Spatial variation means these differences are spread unevenly across geographical space.
At the global scale, many high-income or highly developed countries are in North America, Western Europe, Japan, South Korea, Australia and New Zealand. Many lower-income countries are in parts of sub-Saharan Africa and South Asia. Emerging economies such as Brazil, China, India, Mexico and South Africa often have fast-growing cities and industries, but also strong internal inequalities.
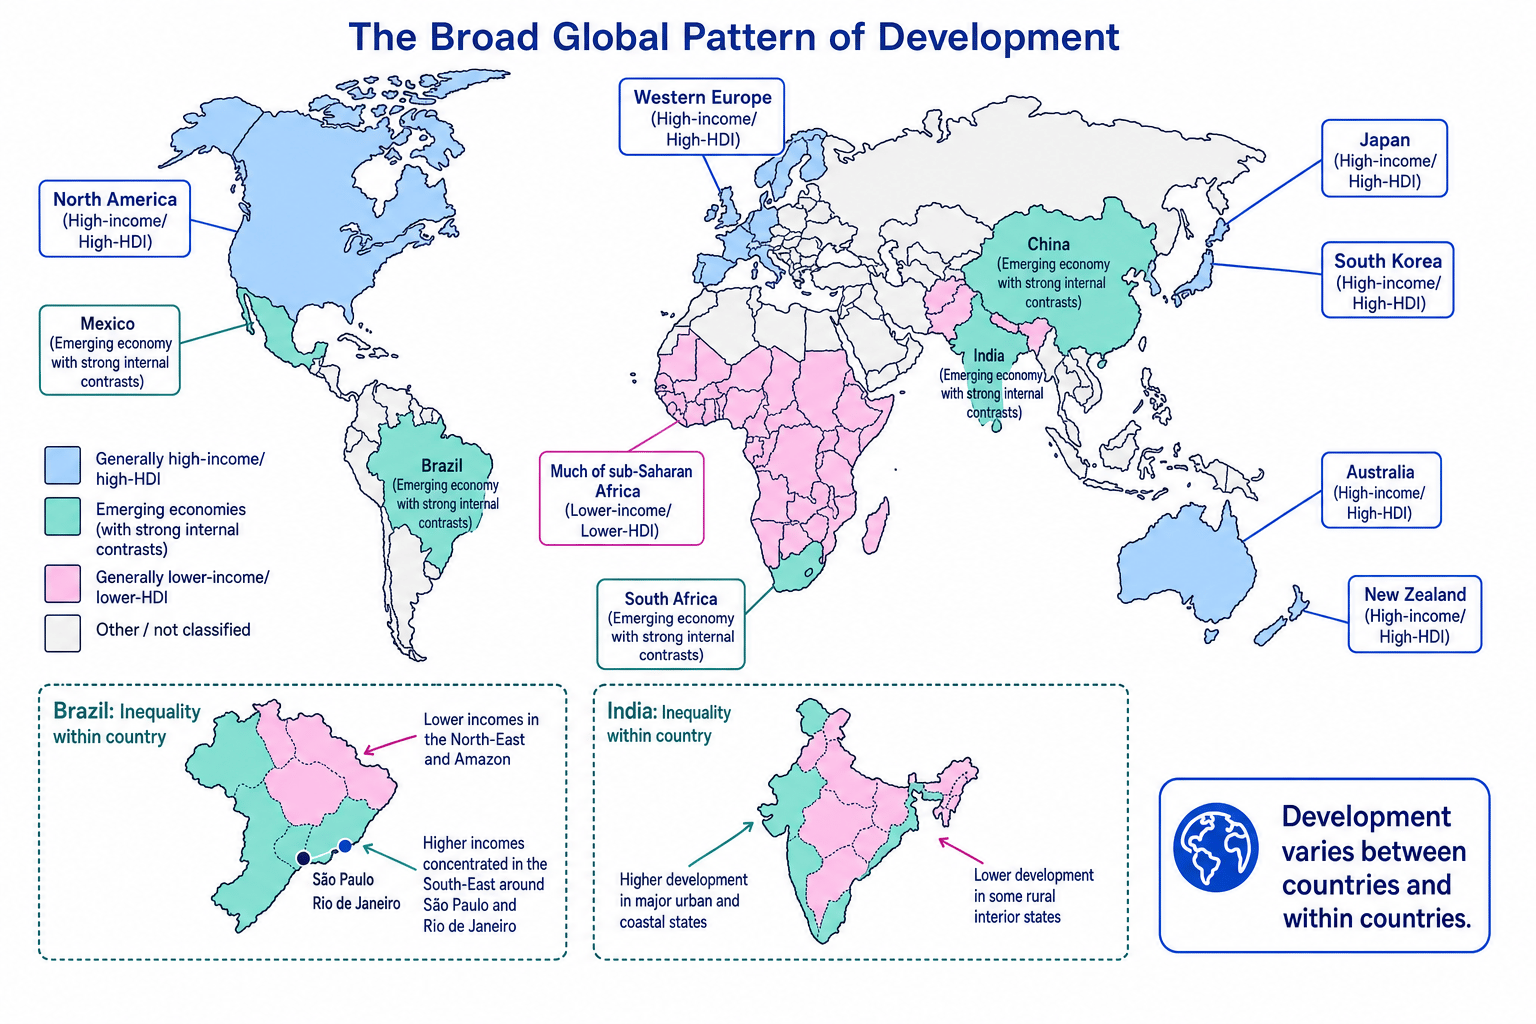
This pattern is not a neat “rich north, poor south” divide. For example, oil-rich Gulf states have high incomes, while some countries in the Southern Hemisphere, such as Australia and New Zealand, are highly developed. Development also varies within countries: capital cities and coastal regions may be much richer than rural interiors or remote regions.
Too simple a North-South divide
Do not write that “all northern countries are rich and all southern countries are poor”. It is a useful starting pattern, but there are many exceptions and strong inequalities within countries.
Describing a development pattern from a map
- At the global scale, group countries into broad regions: for example, Western Europe and North America are generally high-income, while much of sub-Saharan Africa has lower average incomes and HDI scores.
- Add a contrast using named places: South Korea and Japan are highly developed in East Asia, while India is an emerging economy with large internal differences.
- Include within-country variation: Brazil has higher development around São Paulo and Rio de Janeiro, but lower average incomes in parts of the North-East and Amazon region.
3. Why development varies between and within countries
Development differences usually come from several factors working together. The Edexcel specification highlights social, historic and economic factors.
Social factors
Social factors are linked to people and society. These include education, healthcare, gender equality, family size, disease levels, and access to clean water and sanitation.
Where education levels are high, people are more likely to gain skilled work and earn higher incomes. Where healthcare is poor, illness can reduce school attendance, labour productivity and life expectancy. Gender inequality can also hold back development if girls and women have less access to education, employment and healthcare.
Historic factors
Historic factors are past events or long-term processes that still affect places today. Colonialism, slavery, conflict, unequal trade relationships and the timing of industrialisation have all shaped development.
Some countries industrialised early and built strong transport systems, ports, universities and financial institutions. Many colonised countries were pushed into exporting raw materials rather than developing their own manufacturing industries. This helped create long-term dependency on low-value exports such as minerals, timber or crops.
Economic factors
Economic factors involve money, jobs, trade, investment and industry. Countries with diversified economies, good infrastructure and access to global markets often develop faster. Places dependent on one or two primary products can be vulnerable if world prices fall.
Foreign direct investment, or FDI, means investment by companies or governments from another country. FDI can create jobs and infrastructure, but benefits may concentrate in already successful regions.
Cumulative causation
Cumulative causation is a positive feedback process where a successful region attracts more workers, investment, services and infrastructure, making it even more successful over time.
Explaining Brazil’s South-East core
- Brazil’s South-East, especially São Paulo and Rio de Janeiro, has a high concentration of industry, finance, ports, universities and skilled workers.
- Historic investment in coffee exports, ports, manufacturing and later services helped this region become Brazil’s economic core.
- Better infrastructure and a larger skilled workforce attract more businesses and FDI, creating more formal jobs and tax revenue.
- This reinforces cumulative causation: the South-East becomes even more developed, while parts of the North-East and Amazon region struggle to catch up.
4. Uneven development and welfare: Brazil 🌐
For this part of the specification, you need one named country set in its national context. Brazil is a useful example because it is a large emerging economy in South America with a population of over 200 million, but development is very uneven.
Brazil contains wealthy global cities, advanced industries, major ports and large farming regions. However, poverty remains higher in some rural areas, in parts of the North-East, in remote Amazon communities, and in some informal urban settlements.
Uneven development changes life chances
In Brazil, where people live strongly affects their access to secure jobs, good housing, education, healthcare, transport, water and sanitation.
Poverty
Poverty means having too little income or too few resources to meet basic needs. In Brazil, poverty is linked to regional inequality and urban inequality. People in poorer areas may have reduced access to good schools, healthcare, reliable transport and secure employment.
Unemployment and informal work
Unemployment means people who are able and willing to work cannot find paid work. In unequal cities, many people work in the informal economy, meaning jobs are not officially registered or protected. Informal work may include street vending, casual labour or domestic work. It can provide income, but often lacks job security, pensions or legal protection.
Inadequate housing
Inadequate housing means homes that are overcrowded, unsafe, poorly built or lacking basic services. In Rio de Janeiro, some low-income residents live in favelas such as Rocinha. Many favelas are vibrant communities, but some homes are built on steep slopes or flood-prone land, increasing risks from landslides, flooding and fires.
Physical infrastructure
Physical infrastructure means the built systems that allow places to function, such as roads, bridges, electricity networks, water pipes, sewers, drainage, schools and hospitals.
In Brazil, better infrastructure is often concentrated in richer urban cores and industrial regions. Poorer urban outskirts and remote rural areas may have less reliable transport, sanitation, drainage or internet access. This affects welfare because it shapes access to jobs, healthcare and education.
Stereotyping favelas
Do not describe all favelas as identical “slums”. Many have electricity, shops, community organisations and strong social networks, but residents may still face insecure housing, overcrowding or weaker public services.
Building a welfare chain for Brazil
- In a large city such as Rio de Janeiro, formal housing close to jobs can be too expensive for low-income households.
- Some families therefore settle in informal hillside areas where land is cheaper or unofficially occupied.
- Steep slopes and insecure land ownership can reduce investment in drainage, paved roads and sewerage.
- The welfare impact is increased risk from landslides or flooding, longer journeys to work, and poorer access to safe sanitation and emergency services.
5. Demographic data and levels of development
Demographic data means statistics about populations, such as birth rates, death rates, age structure and mortality rates. These data often change as countries develop.
Core demographic terms
- Fertility rate: the average number of children a woman is expected to have in her lifetime.
- Birth rate: the number of live births per 1000 people per year.
- Death rate: the number of deaths per 1000 people per year.
- Natural increase: population growth caused by births being higher than deaths, excluding migration.
- Population structure: the proportion of people in different age and sex groups, often shown on a population pyramid.
- Infant mortality rate: deaths of babies under age 1 per 1000 live births.
- Maternal mortality rate: deaths of mothers from pregnancy or childbirth per 100,000 live births.
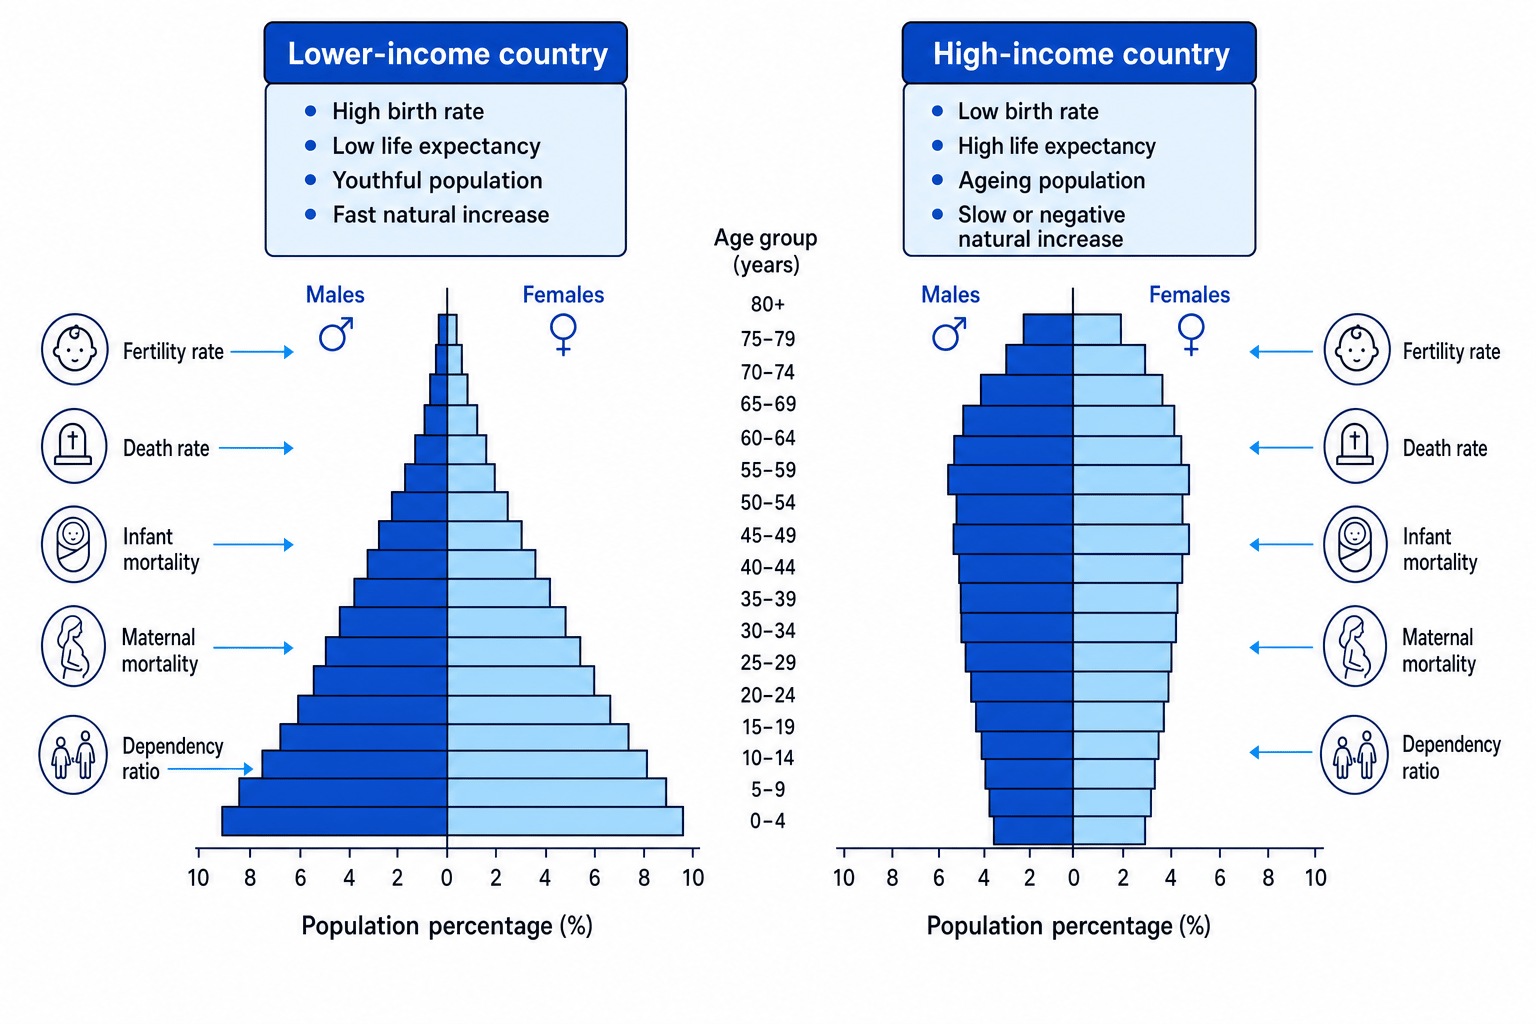
Population pyramids are a quick way to compare development. A wide base usually shows high fertility and a youthful population. A narrower base and wider older age groups often show lower fertility, higher life expectancy and an ageing population.
| Indicator | Lower-income countries often show | Emerging countries often show | High-income countries often show |
|---|---|---|---|
| Fertility rate | Higher, often because contraception, female education and pensions are less available | Falling as education, urbanisation and healthcare improve | Low, often below replacement level of about 2.1 children per woman |
| Death rate | Can be higher where disease, conflict or poor healthcare are major issues | Often falling due to better healthcare and sanitation | Low health risk, but crude death rate can look higher where many people are elderly |
| Natural increase | Usually high if birth rates stay high while death rates fall | Slowing as fertility falls | Low, zero or negative |
| Population structure | Wide base, youthful population, fewer elderly people | Large working-age population | Narrower base, ageing population, more elderly dependants |
| Maternal and infant mortality | Higher where healthcare access, nutrition and sanitation are poorer | Falling with improved services | Very low due to skilled birth attendance and advanced healthcare |
Death rate is affected by age structure
A high-income country can have a higher crude death rate than a younger developing country because it has more elderly people. Death rate alone does not prove healthcare is poor.
Calculating natural increase
Using rounded recent-style values, Niger has had a birth rate of about 44 per 1000 and a death rate of about 8 per 1000. Japan has had a birth rate of about 6 per 1000 and a death rate of about 12 per 1000. Exact data changes by year.
natural increase per 1000=birth rate−death ratenatural increase percentage=natural increase per 10001000×100\begin{aligned} \text{natural increase per 1000} &= \text{birth rate} - \text{death rate} \\ \text{natural increase percentage} &= \frac{\text{natural increase per 1000}}{1000} \times 100 \end{aligned}natural increase per 1000natural increase percentage=birth rate−death rate=1000natural increase per 1000×100- For Niger, subtract deaths from births: 44−8=3644 - 8 = 3644−8=36 per 1000.
- Convert to a percentage: 361000×100=3.6%\frac{36}{1000} \times 100 = 3.6\%100036×100=3.6% natural increase per year.
- For Japan, subtract deaths from births: 6−12=−66 - 12 = -66−12=−6 per 1000.
- Convert to a percentage: −61000×100=−0.6%\frac{-6}{1000} \times 100 = -0.6\%1000−6×100=−0.6%, showing negative natural increase before migration is considered.
- Interpret the contrast: Niger’s youthful population is likely to grow rapidly, while Japan’s ageing population is likely to shrink without immigration.
How to compare demographic data
Use the unit and the trend: “Country A has a fertility rate of 5 children per woman, much higher than Country B’s 1.4, so Country A is likely to have a wider pyramid base and faster natural increase.”
In the exam
- Use named places at different scales: global regions, a named country such as Brazil, and named cities or regions within it.
- Link causes and consequences clearly: do not just list “poverty” or “housing”; explain how uneven development affects welfare.
- For demographic data, check the unit carefully: fertility is children per woman, death rate is per 1000 people, and maternal mortality is per 100,000 live births.
Check yourself
- Why is the global pattern of development more complex than a simple “rich north, poor south” divide?
- How can uneven development in Brazil affect housing and physical infrastructure?
- What does a wide-based population pyramid suggest about fertility rate and natural increase?
