What you'll learn
- Why development can be defined in different ways.
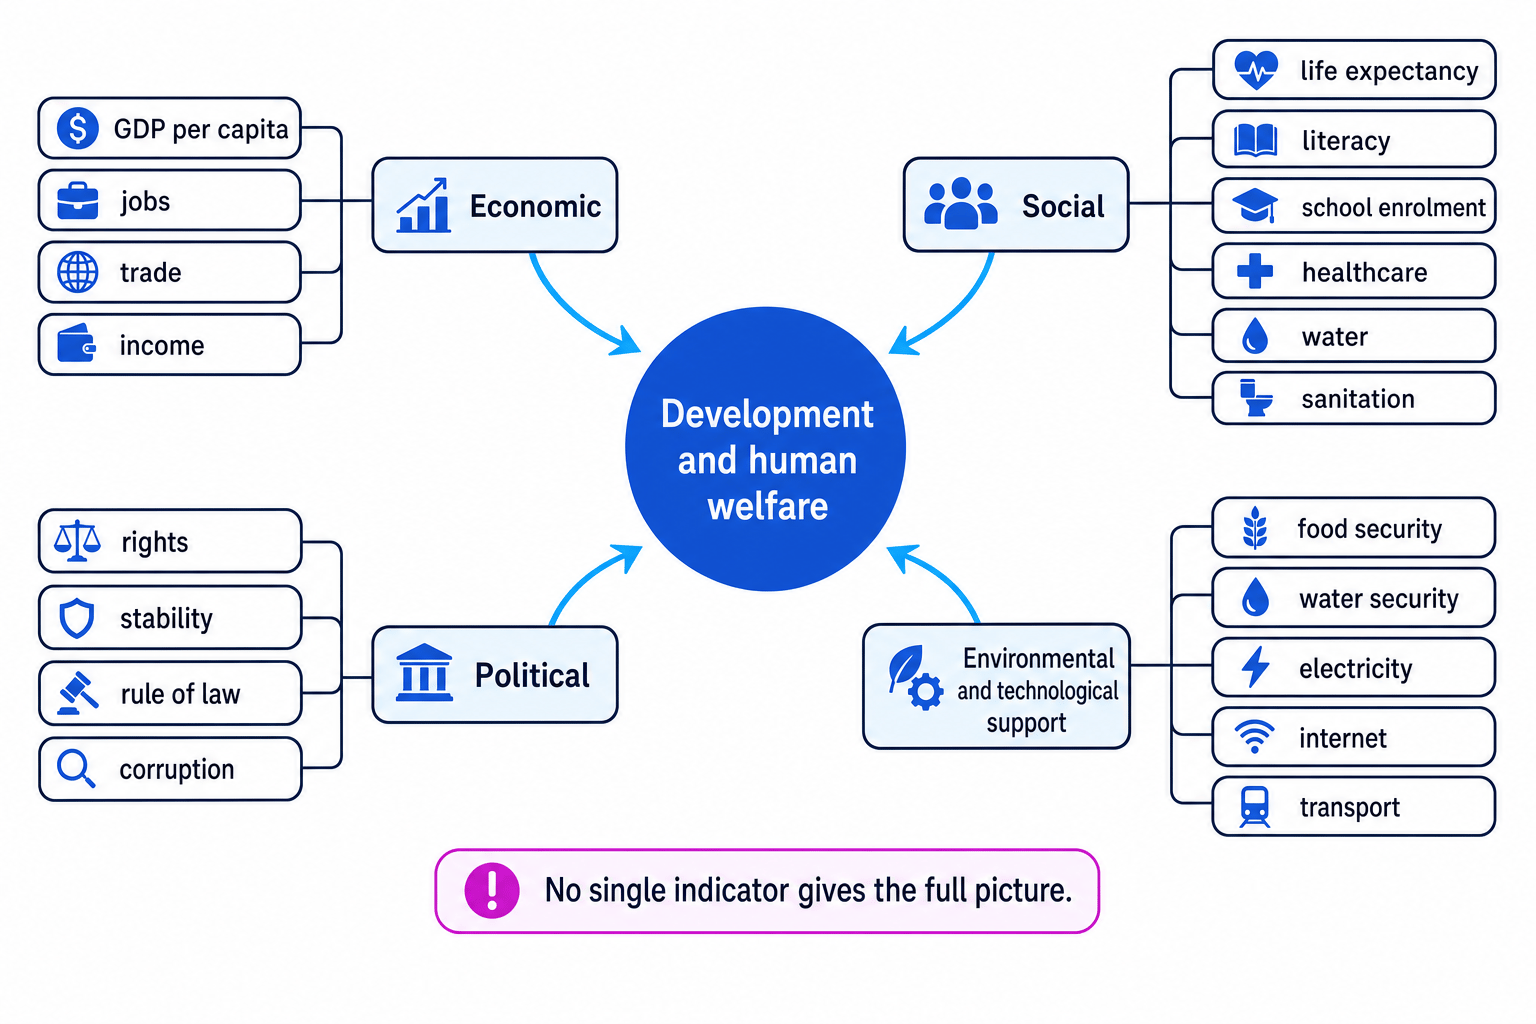
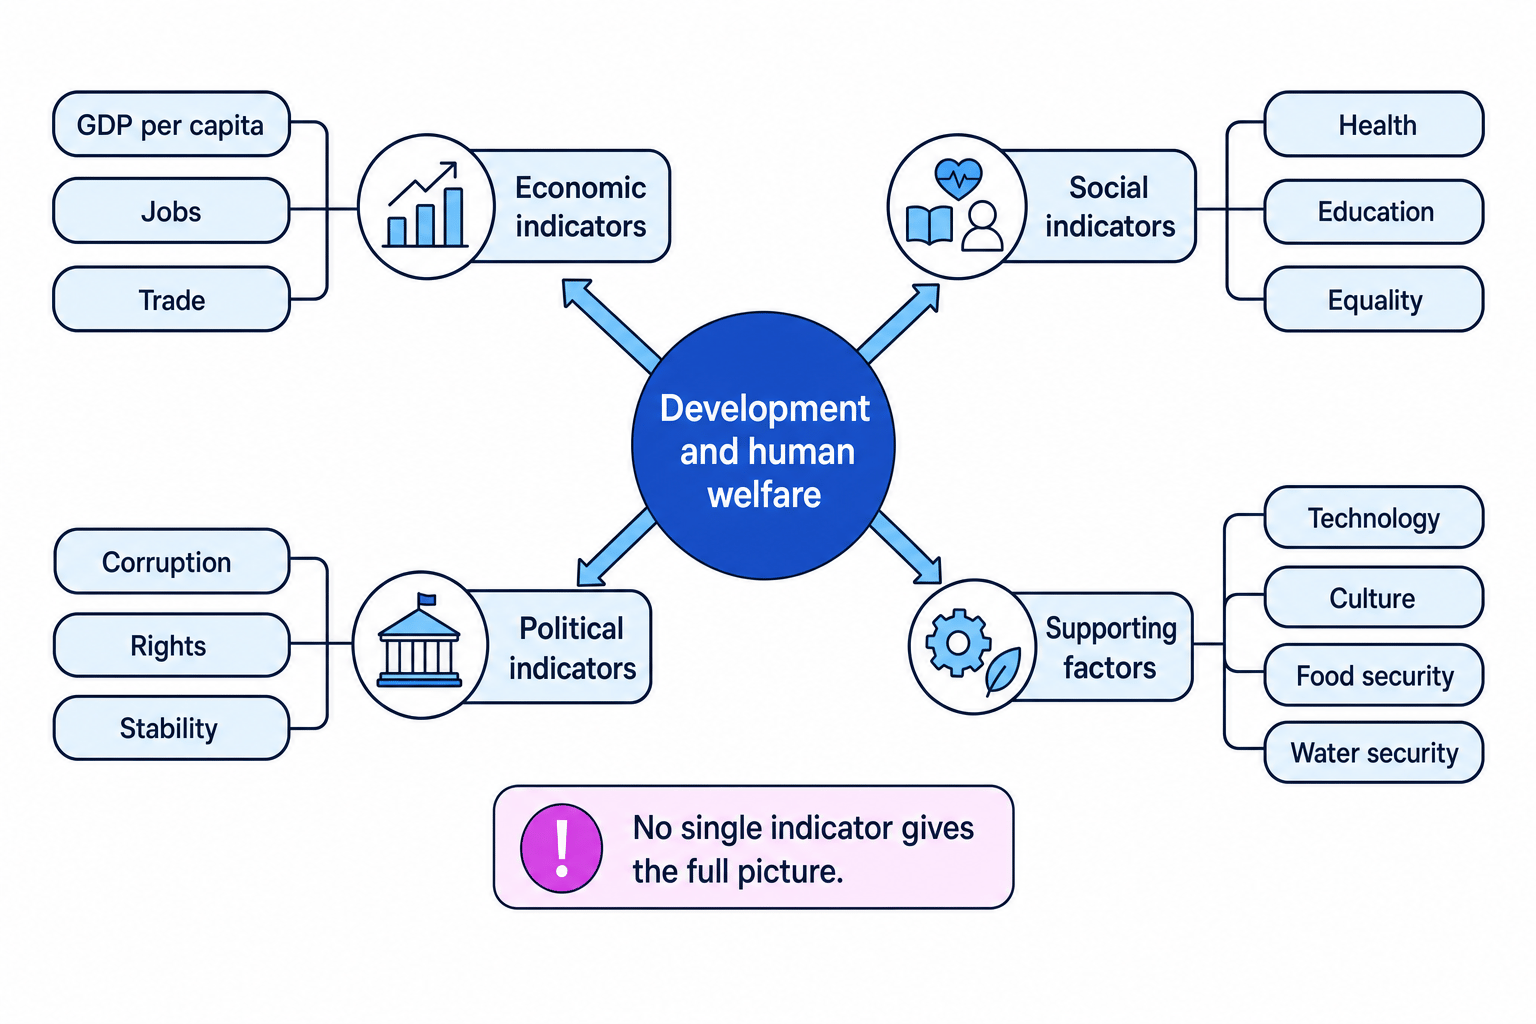
- How human welfare depends on economic, social, political, technological and environmental factors.
- How to use indicators such as GDP per capita, HDI, inequality and corruption indices.
- Why no single measure gives a complete picture of a country’s development.
1. Starting point: what does “development” mean?
In geography, development is not just about a country “getting richer”. It is about improvement in people’s quality of life, opportunities and wellbeing.
A country may have a large economy but still have poor housing, unequal access to healthcare, political corruption, or unreliable water supplies. This is why geographers use several different indicators rather than only one.
Development
Development means the process of economic, social, political and technological improvement that increases people’s quality of life and opportunities.
Human welfare
Human welfare means people’s overall wellbeing, including health, education, income, safety, rights, access to food and water, and freedom from extreme poverty or conflict.
This topic is about comparing countries fairly. You might compare a developed country such as the UK, Japan or Norway with a developing or emerging country such as India, Nigeria or Brazil. These labels are useful, but they can hide big differences within countries.
Big idea
Development is multi-dimensional: it includes wealth, health, education, equality, political freedom, security and access to basic resources.
2. Different ways of defining development
Economic definitions
An economic definition focuses on money, production and jobs. It asks questions such as:
- How much wealth does the country produce?
- What is average income per person?
- How many people have secure employment?
- How much trade and investment does the country attract?
The most common economic measure in this topic is GDP per capita.
GDP per capita
Gross Domestic Product per capita is the total value of goods and services produced in a country in one year, divided by the population. It is usually given in US$ per person.
GDP per capita is useful because it gives a quick comparison of average economic output. For example, Luxembourg, Singapore and Qatar usually have very high GDP per capita, while countries affected by conflict or very low industrial development often have much lower figures.
But GDP per capita is only an average. It does not show whether wealth is shared fairly.
Calculating GDP per capita
A country has a total GDP of US$600 billion and a population of 50 million.
-
Use the formula:
GDP per capita=total GDPpopulation\text{GDP per capita} = \frac{\text{total GDP}}{\text{population}}GDP per capita=populationtotal GDP -
Substitute the values, keeping the scale of the numbers clear:
GDP per capita=US$600 billion50 million people\text{GDP per capita} = \frac{\text{US{\char"24}600 billion}}{\text{50 million people}}GDP per capita=50 million peopleUS$600 billion -
Divide 600 billion by 50 million:
GDP per capita=US$12,000 per person\text{GDP per capita} = \text{US{\char"24}12,000 per person}GDP per capita=US$12,000 per person -
Interpret the answer: this country produces an average of US12,000ofeconomicoutputperperson,butthisdoes<strong>not</strong>provethateverypersonearnsUS12,000 of economic output per person, but this does <strong>not</strong> prove that every person earns US12,000ofeconomicoutputperperson,butthisdoes<strong>not</strong>provethateverypersonearnsUS12,000.
Average income trap
Do not write that GDP per capita shows what “everyone earns”. It is an average economic output per person, and it can hide inequality.
Broader social definitions
A social definition of development focuses on people’s everyday lives. It includes:
- Life expectancy: the average number of years a person is expected to live.
- Infant mortality rate: the number of babies who die before their first birthday, usually per 1000 live births.
- Literacy rate: the percentage of adults who can read and write.
- School enrolment: the proportion of children attending school.
- Access to healthcare, safe water, sanitation and housing.
For example, Cuba has often been used as an example of a country with relatively strong health and education outcomes compared with what its income level might suggest. This shows why social indicators matter.
Political definitions
A political definition looks at how a country is governed and whether people have rights, safety and a voice in decision-making.
Important political measures include:
- Political stability: whether government is secure and conflict is limited.
- Rule of law: whether laws are applied fairly.
- Human rights: freedoms such as speech, voting and protection from discrimination.
- Corruption: misuse of public power for private gain.
A country with high income but weak political rights or high corruption may not provide good human welfare for all citizens.
3. Factors that contribute to development and human welfare
Development is caused by many connected factors. You should avoid giving one simple cause such as “the country is poor because of climate” or “rich because of resources”.
Economic factors
Economic factors include employment, wages, trade, investment, debt and the type of industries a country has.
Countries with a large manufacturing or service sector often generate more income than countries that rely heavily on exporting raw materials. For example, South Korea’s rapid industrialisation after the 1960s helped it become a high-income, highly developed country. By contrast, some resource-rich countries have struggled when profits are unevenly shared or lost through corruption.
Social factors
Social factors include health, education, gender equality and population structure.
Education improves skills, which can raise wages and attract investment. Healthcare improves life expectancy and reduces days lost to illness. Gender equality can increase development because more people can take part in education, work and leadership.
Technological factors
Technology includes tools, machinery, transport, electricity, internet access and communication systems.
Technology can speed up development by improving farming, healthcare, banking and education. For example, mobile banking in Kenya, such as M-Pesa, has helped many people transfer money and access services without needing a traditional bank branch.
Cultural factors
Culture means the values, beliefs, customs and ways of life shared by groups of people. Culture can influence education, family size, gender roles, work patterns and community support.
This must be handled carefully: culture is not fixed, and no culture is simply “better” or “worse” for development. Development is shaped by history, politics, trade, colonialism, environment and global relationships as well as cultural choices.
Avoid cultural stereotypes
In exam answers, do not explain a country’s development by blaming “culture” in a vague way. Link cultural factors to specific evidence, such as education choices, gender roles, language access or community support systems.
Food security
Food security
Food security means people have reliable physical and economic access to enough safe, nutritious food for an active and healthy life.
Food security affects welfare directly. If people are undernourished, children may struggle at school and adults may be less able to work. Food insecurity can be caused by drought, conflict, high food prices, poor transport, low income or dependence on imported food.
Water security
Water security
Water security means having reliable access to enough safe water for drinking, sanitation, farming and industry, while being protected from water-related hazards such as floods and droughts.
Water security supports health, farming and economic growth. Countries with unreliable water supplies may face disease, reduced crop yields and time lost collecting water. For example, parts of the Sahel face pressure from drought and climate variability, while cities such as Cape Town have shown that even more developed places can face serious water stress.
Factors work together
Development usually improves fastest when several factors improve together: education, healthcare, jobs, infrastructure, technology, food security, water security and good governance.
4. Measuring development: key indicators
GDP per capita
GDP per capita is simple and widely available, so it is useful for quick comparisons. However, it does not measure:
- inequality within a country
- unpaid work, such as childcare
- environmental damage
- political freedom
- health or education outcomes
- whether wealth is spent on public services
A country with very high oil income may have high GDP per capita but still have unequal opportunities or limited political freedoms.
Human Development Index
The Human Development Index, usually shortened to HDI, is a broader measure created by the United Nations.
Human Development Index
The HDI is a development index from 0 to 1 that combines health, education and income. A higher score means higher human development.
HDI includes three main dimensions:
| Dimension | Indicator used | Why it matters |
|---|---|---|
| Health | Life expectancy | Shows how long people are expected to live |
| Education | Years of schooling | Shows access to knowledge and skills |
| Income | GNI per capita adjusted for prices | Shows average material living standards |
HDI is stronger than GDP per capita because it includes social welfare, not just money. Countries are often grouped as very high, high, medium or low human development. The exact scores change each year depending on the UN dataset used.
GDP versus HDI
If the question asks for a “broader” measure of development, HDI is usually better than GDP per capita because it includes health and education as well as income.
Measures of inequality
Even if a country’s average income rises, development may remain uneven. Inequality means the unequal distribution of income, wealth, opportunities or services between people or places.
Gini coefficient
The Gini coefficient is a measure of income inequality. A score of 0 means perfect equality, while 1 means complete inequality. Some sources show it as 0 to 100 instead.
A high Gini score suggests that wealth is concentrated among fewer people. South Africa and Brazil are often discussed as countries with high income inequality, although exact figures vary by year and source. Many Scandinavian countries tend to have lower inequality due to stronger welfare systems and redistribution.
Inequality can also be measured using:
- the share of national income received by the richest 10%
- the percentage of people below a poverty line
- regional differences in income or services
- gender inequality measures
Indices of political corruption
Corruption
Corruption is the misuse of public power for private gain, such as bribery, favouritism or stealing public money.
A common measure is the Corruption Perceptions Index from Transparency International. It scores countries from 0 to 100, where 0 means highly corrupt and 100 means very clean.
Corruption matters because it can reduce human welfare. Money intended for roads, hospitals or schools may be diverted. Businesses may avoid investing. People may have to pay bribes to access basic services.
Reading corruption scores backwards
For the Corruption Perceptions Index, a higher score means less perceived corruption. Do not assume a higher corruption index number always means “more corrupt”.
5. Why different measures give different rankings
Countries can rank differently depending on the indicator you choose.
A country may have:
- high GDP per capita but high inequality
- good education but weak political freedom
- high HDI but regional poverty
- low income but strong community health outcomes
- strong economic growth but poor water security
Comparing two countries using mixed indicators
Imagine two countries have the following data:
| Indicator | Country A | Country B |
|---|---|---|
| GDP per capita | US$65,000 | US$28,000 |
| HDI | 0.82 | 0.89 |
| Gini coefficient | 0.45 | 0.27 |
| Corruption Perceptions Index | 45 | 82 |
-
Compare economic output first: Country A has the higher GDP per capita, so it appears wealthier using a purely economic measure.
-
Compare wider welfare: Country B has the higher HDI, so its people may have better combined health, education and income outcomes.
-
Compare inequality: Country A’s Gini coefficient is higher, so income is likely to be less evenly shared than in Country B.
-
Compare governance: Country B’s corruption score is higher, which means lower perceived corruption on this index.
-
Reach a balanced judgement: Country A is richer on average, but Country B appears more developed overall because it has higher HDI, lower inequality and less perceived corruption.
6. How to write about this in Edexcel IGCSE Geography
For 4GE1, you need to be comfortable using development data, especially in tables, graphs and maps. You may be asked to compare countries, suggest reasons for differences, or evaluate the usefulness of indicators.
Good answers usually do three things:
- Use evidence: quote figures from the resource, such as GDP per capita in US$ or HDI score.
- Compare clearly: use words like “higher”, “lower”, “more unequal”, “less corrupt” and “wider gap”.
- Judge usefulness: explain what an indicator shows and what it hides.
In the exam
- When comparing development, use at least two types of evidence: one economic indicator and one social or political indicator.
- Be careful with direction: high HDI is good, high GDP per capita usually suggests wealth, high Gini means more inequality, and high CPI means less perceived corruption.
- Finish evaluative answers by saying why no single indicator gives the full picture of human welfare.
Check yourself
- Why can GDP per capita be misleading when judging human welfare?
- What three dimensions are included in the Human Development Index?
- How could corruption reduce development even in a country with valuable natural resources?