The diagram shows a marine food chain.
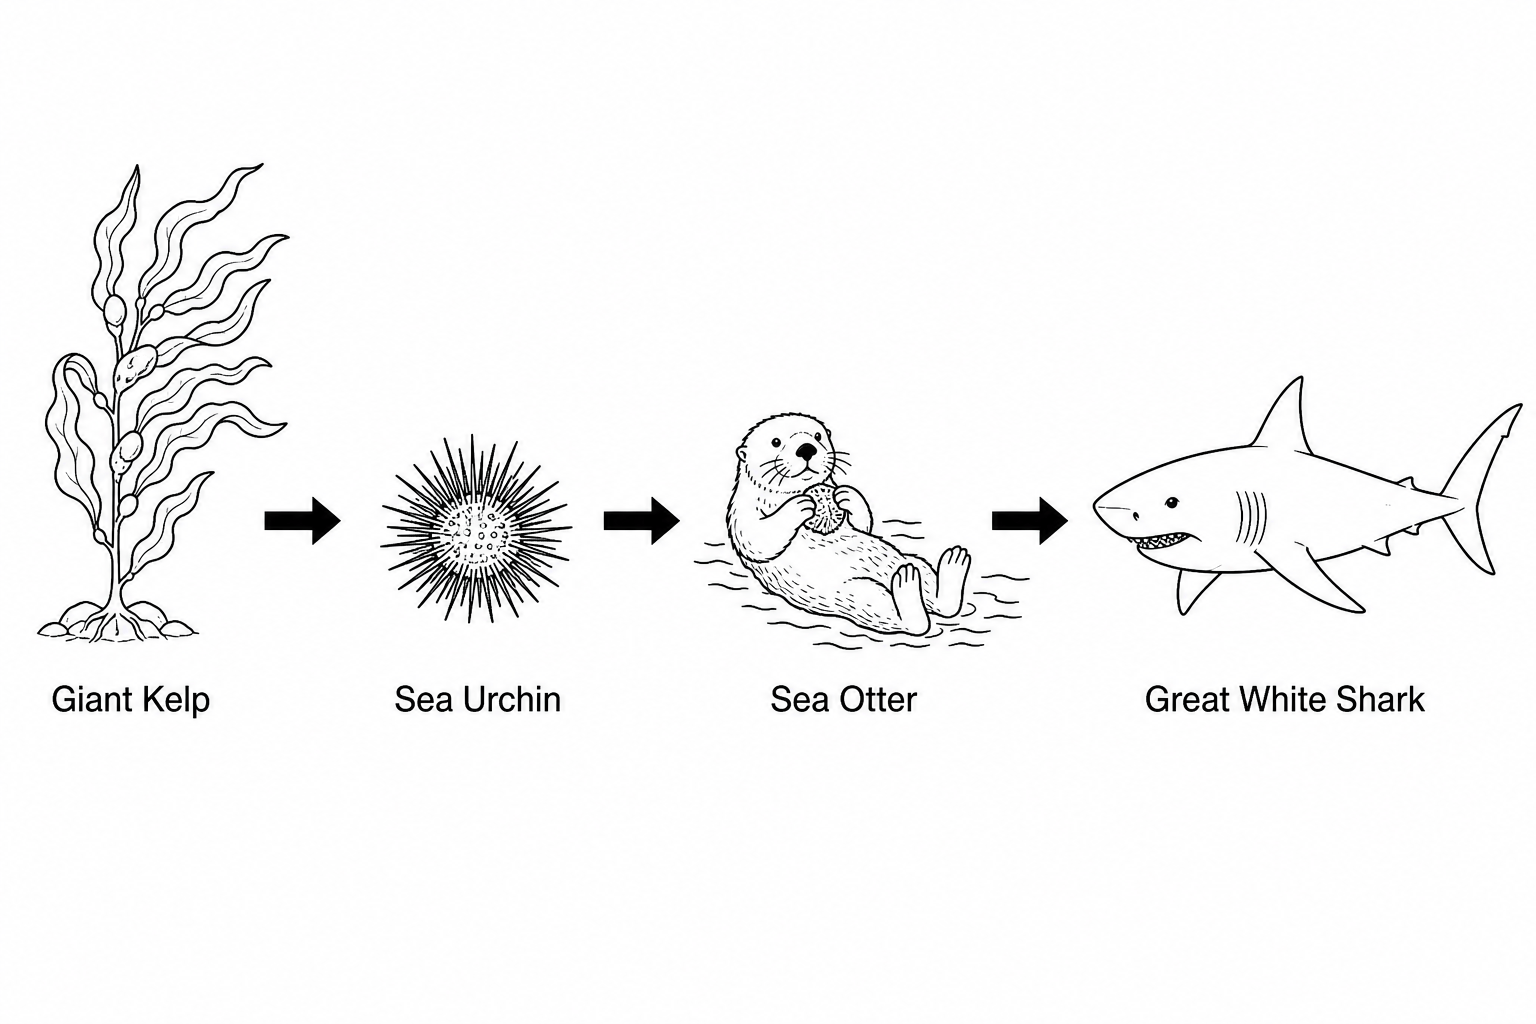
How many consumers are shown in this food chain?
What term describes the trophic level of the Great White Shark?
Light is an abiotic (non-living) factor that affects the growth of giant kelp. Explain the role of light in helping the growth of giant kelp.
Scientists measured the average (mean) daily increase in dry mass of giant kelp in a square metre of a kelp forest in two different regions of the Pacific Ocean. They also measured the daily photosynthetically active radiation (PAR) light energy available in a square metre of each of the two regions.
The table shows their results.
| Region of the Pacific Ocean | Average daily increase in mass in g | Daily light energy available in kJ |
|---|---|---|
| Channel Islands (California) | 120 | 4000 |
| Aleutian Islands (Alaska) | 18 | 1500 |
The scientists expected that the same light energy would produce the same average daily increase in dry mass of giant kelp in each region of the Pacific Ocean. However, the results show that the average daily increase in dry mass of giant kelp produced in the Aleutian Islands was less than they expected. Calculate the average daily increase in dry mass the scientists expected to be produced in the Aleutian Islands.
Name two other abiotic factors that could limit the growth of giant kelp.
Give three reasons why not all of the energy available in the giant kelp is transferred to the Great White Shark.