

What you'll learn
- How to investigate the distribution and abundance of organisms in a habitat.
- How to use quadrats, transects, pooters, nets, keys, and capture-recapture.
- How human actions can reduce or protect biodiversity.
- Why conservation brings benefits, but also practical and political challenges.
Starting point: ecosystems and biodiversity
An ecosystem is all the living organisms in an area, plus the non-living conditions they interact with. The place where an organism lives is its habitat.
A population is all the organisms of one species in an area. A community is all the different populations living together.
Biotic factors are living factors, such as predators, prey, competitors and disease. Abiotic factors are non-living factors, such as light intensity, temperature, soil pH, water availability and pollution.
Biodiversity
Biodiversity is the variety of living organisms in an area. It includes the number of different species and the variation within those species.
Monitoring the environment means collecting data about the natural world over time, then using that data to spot patterns and possible causes.
Distribution and abundance
Distribution and abundance
The distribution of a species is where it is found in a habitat. Its abundance is how many individuals are present, or how much of the area they cover.
For example, daisies might be more abundant in short grass than in shaded woodland. Their distribution might be clumped in sunny patches rather than spread evenly.
Scientists usually cannot count every organism in a habitat. Instead, they take samples: smaller sections or groups that are used to estimate the whole population.
Good sampling
A good sample should be representative of the habitat, large enough to be reliable, and collected using a method that avoids bias.
Sampling with quadrats and transects
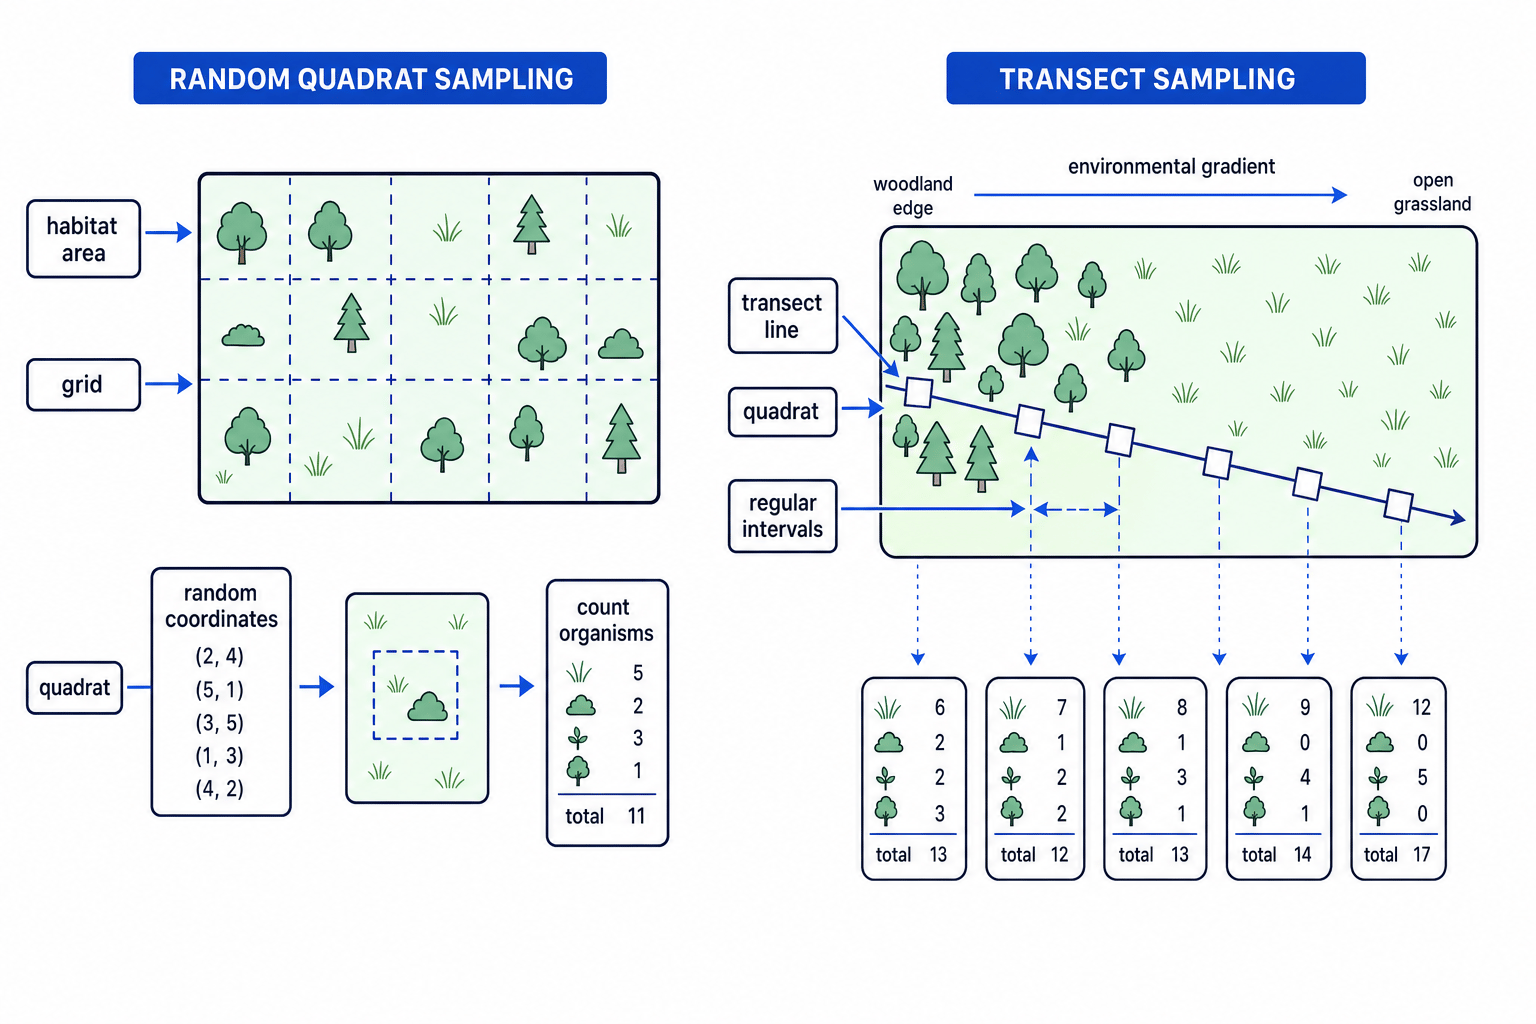
A quadrat is a square frame of known area, often 0.25 square metres or 1 square metre, used to sample plants or slow-moving organisms.
Random sampling means every part of the habitat has an equal chance of being chosen. You can use random coordinates from a grid, place the quadrat at those positions, then count organisms or estimate percentage cover.
A transect is a line across a habitat. Systematic sampling uses a regular pattern, such as placing a quadrat every 2 metres along the transect. Transects are useful when an abiotic factor changes across the habitat, such as distance from a path, shore height, light intensity or pollution level.
What to record
For plants, you might record:
- the number of individuals in each quadrat
- percentage cover, meaning the percentage of the quadrat covered by that species
- frequency, meaning the percentage of quadrats where the species is present
For small invertebrates, a pooter is a device used to collect tiny animals safely by suction. A net can collect organisms from water, long grass or the air. A key is a guide that helps you identify organisms using visible features, often through yes/no choices.
Biased quadrat placement
Do not place quadrats only where the species is easy to see. That would overestimate abundance. Use random coordinates unless you are deliberately sampling along a transect.
Calculating means and scaling up
An arithmetic mean is found by adding all the readings and dividing by the number of readings.
mean=total of all readingsnumber of readings\text{mean} = \frac{\text{total of all readings}}{\text{number of readings}}mean=number of readingstotal of all readingsTo estimate the total number of organisms in a habitat, first calculate the mean number per quadrat, then convert it to a density, then scale up to the total area.
Calculating a mean and scaling up
A student samples daisies using ten quadrats. Each quadrat is 0.5 m by 0.5 m. The counts are: 3, 5, 0, 4, 6, 2, 5, 4, 1, 0. The whole field is 120 square metres.
-
Work out the area of one quadrat: 0.5 m×0.5 m=0.25 m20.5\ \text{m} \times 0.5\ \text{m} = 0.25\ \text{m}^20.5 m×0.5 m=0.25 m2.
-
Calculate the mean number of daisies per quadrat: (3+5+0+4+6+2+5+4+1+0)÷10=30÷10=3.0(3 + 5 + 0 + 4 + 6 + 2 + 5 + 4 + 1 + 0) \div 10 = 30 \div 10 = 3.0(3+5+0+4+6+2+5+4+1+0)÷10=30÷10=3.0 daisies per quadrat.
-
Convert this to density: 3.0÷0.25=123.0 \div 0.25 = 123.0÷0.25=12 daisies per square metre.
-
Scale up to the whole field: 12×120=144012 \times 120 = 144012×120=1440 daisies.
This is an estimate, not an exact count. More quadrats usually make the estimate more reliable, but the method takes longer.
Choosing a transect
A student wants to investigate whether clover abundance changes with distance from a footpath.
-
The independent variable is distance from the path, so a transect is suitable because distance changes in a clear direction.
-
The student places quadrats at regular distances, such as every 1 m, and records clover percentage cover in each one.
-
The student plots distance from the path on the x-axis and clover abundance on the y-axis. If clover increases away from the path, this suggests trampling near the path may reduce clover growth.
Graphs from fieldwork
Use a bar chart for separate categories, such as different habitats. Use a line graph or scatter graph when the x-axis is continuous, such as distance, time or concentration.
Capture-recapture for mobile animals
Quadrats are not ideal for animals that move around quickly. For mobile animals, scientists can use capture-recapture.
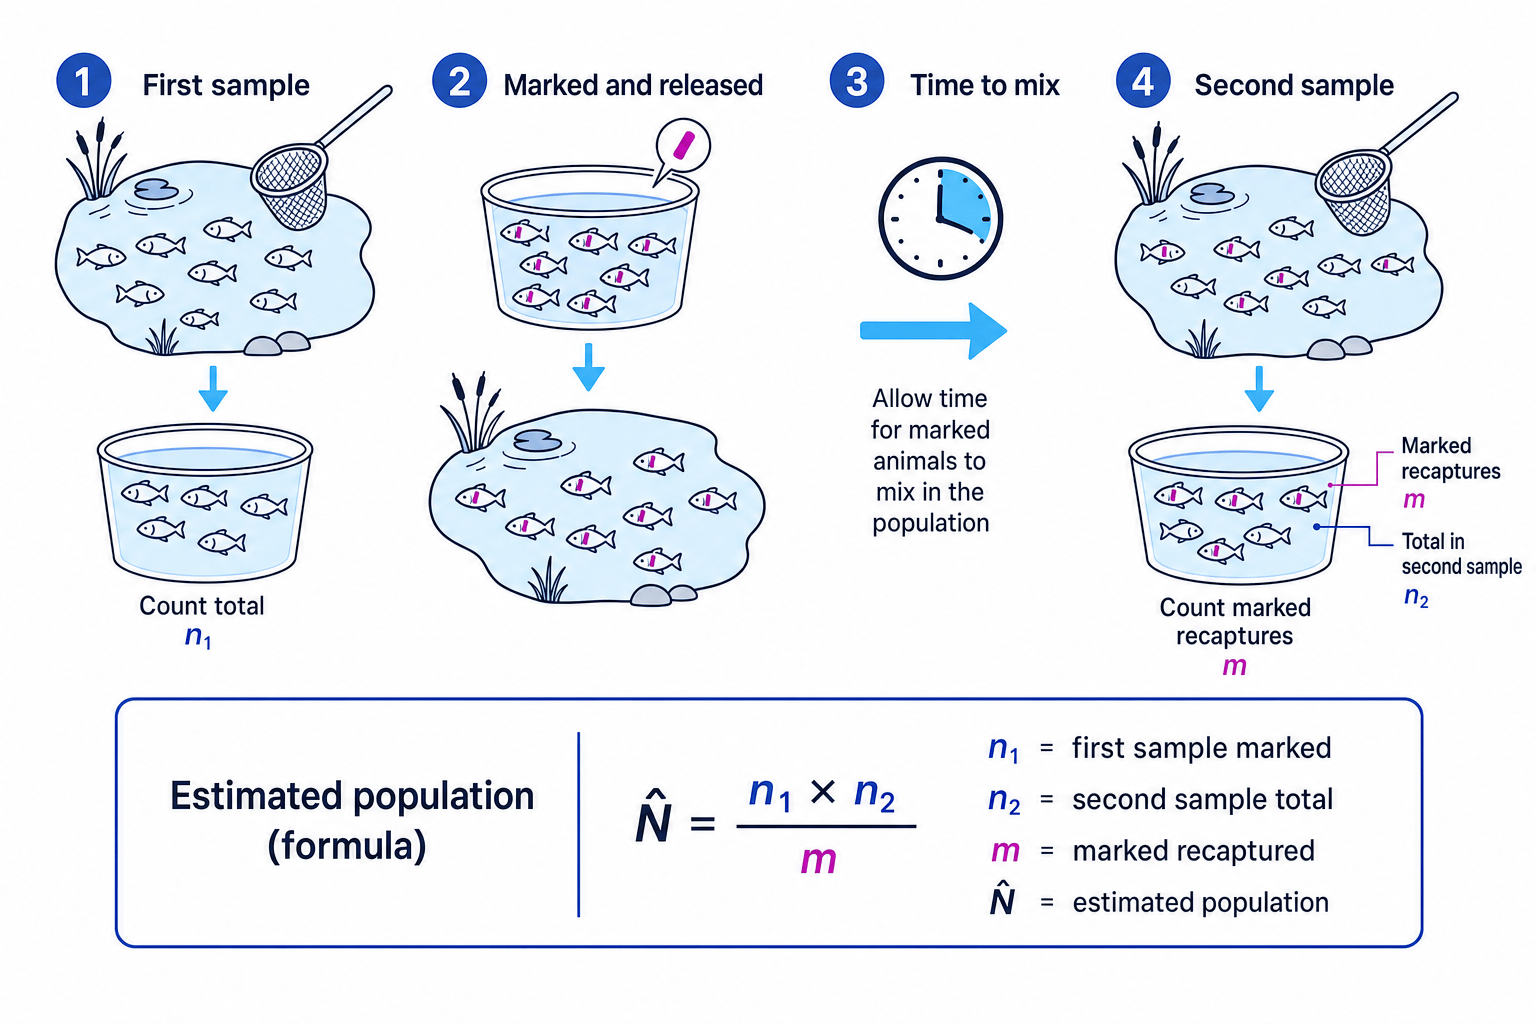
In this method, animals are captured, counted, marked harmlessly, released, allowed time to mix back into the population, then captured again. The proportion of marked animals in the second sample is used to estimate the total population.
The estimate is:
N^=n1×n2m\hat{N} = \frac{n_1 \times n_2}{m}N^=mn1×n2where N^\hat{N}N^ is the estimated population size, n1n_1n1 is the number marked in the first sample, n2n_2n2 is the total number in the second sample, and mmm is the number of marked individuals recaptured.
Estimating a population by capture-recapture
A student captures 40 pond snails, marks them safely and releases them. Later, she captures 50 pond snails. 10 of these are marked.
-
Substitute the values into the formula: N^=40×5010\hat{N} = \frac{40 \times 50}{10}N^=1040×50.
-
Calculate the numerator: 40×50=200040 \times 50 = 200040×50=2000.
-
Divide by the number of marked recaptures: 2000÷10=2002000 \div 10 = 2002000÷10=200 pond snails.
When capture-recapture is unreliable
Capture-recapture assumes the marks do not rub off or harm the animals, marked animals mix fully back into the population, and there are no major births, deaths, immigration or emigration between samples.
Percentiles in environmental data
Percentile
A percentile tells you the value below which a percentage of results lie. The 50th percentile is the median, or middle value.
Percentiles are useful when comparing one site with a large set of environmental data.
Using percentiles to judge a site
A survey of ponds shows that the 25th percentile for species richness is 8 species. One pond contains 6 species.
-
Compare the pond with the percentile value: 6<86 < 86<8, so the pond is below the 25th percentile.
-
This means the pond is in roughly the lowest quarter of ponds for species richness.
-
This suggests low biodiversity, but you would need repeated sampling and information about other factors before deciding the cause.
Human interactions with ecosystems
Human activity can harm ecosystems, but humans can also protect and restore them.
Negative interactions include:
- land use change, such as deforestation, farming, road building and urban development
- habitat destruction and habitat fragmentation
- hunting, overfishing or poaching
- pollution, including air pollution that can affect lichens and acid rain that can affect plant growth
These can reduce population sizes, remove food sources, break up habitats and reduce biodiversity.
Positive interactions include:
- protecting endangered species by law
- captive breeding and reintroduction programmes
- creating nature reserves and protected marine areas
- restoring habitats, such as wetlands, hedgerows or woodland
- controlling hunting and fishing with quotas or closed seasons
Link the action to biodiversity
In exam answers, do not just say “humans damage biodiversity”. Explain the chain: human action → habitat or population change → effect on species numbers → biodiversity increases or decreases.
Humans are not always negative
A common weak answer is to describe only damage. The specification expects you to know both negative and positive human interactions with ecosystems.
Maintaining biodiversity: benefits and challenges
Maintaining biodiversity has many benefits. Diverse ecosystems are often more stable because if one species declines, others may still carry out similar roles. Biodiversity also supports ecosystem services, which are useful natural processes such as pollination, soil formation, clean water, carbon storage and decomposition.
Biodiversity can also provide food resources, medicines, useful genes for crop breeding, and cultural or ethical value.
Ecotourism is tourism based on visiting natural environments while aiming to support conservation and local people. It can bring money and jobs, giving communities a reason to protect habitats and species.
However, conservation is not simple. It can be expensive, it needs long-term monitoring, and it may conflict with farming, housing, industry or local livelihoods. Global conservation is even harder because countries may disagree about costs, land use, enforcement and who should benefit.
Ecotourism can also cause problems if it is badly managed: visitors may disturb wildlife, damage paths, produce waste or increase transport emissions.
Monitoring conservation schemes
To judge whether a conservation scheme is working, scientists need evidence. They might compare biodiversity before and after the scheme, or compare a protected site with a similar unprotected site.
Good monitoring uses the same sampling method each time, enough repeat samples, and clear records of abiotic factors. Graphs and tables can show trends, but a pattern alone does not always prove cause and effect.
In the exam
-
Name the sampling method and justify it: random quadrats for representative plant samples, transects for gradients, and capture-recapture for mobile animals.
-
In calculations, show the mean, density or capture-recapture substitution clearly, and keep units such as square metres where needed.
-
For biodiversity questions, link each human action to a specific effect on habitats, populations, food webs or species richness.
Check yourself
- How would you estimate the number of daisies in a 200 square metre field using quadrats?
- Why is a transect better than random quadrats for investigating distance from a polluted road?
- What assumptions must be true for capture-recapture to give a reliable estimate?
