Energy stores, transfers and conservation

EasyMediumHard
123456789101112131415161718192021222324252627282930313233343536373839404142434445464748495051525354555657585960616263646566676869707172737475767778798081
Question 81
Easy

Glass wool, commonly used for loft insulation, can be manufactured at various densities.

Figure 1 shows how the thermal conductivity of glass wool changes with its density.
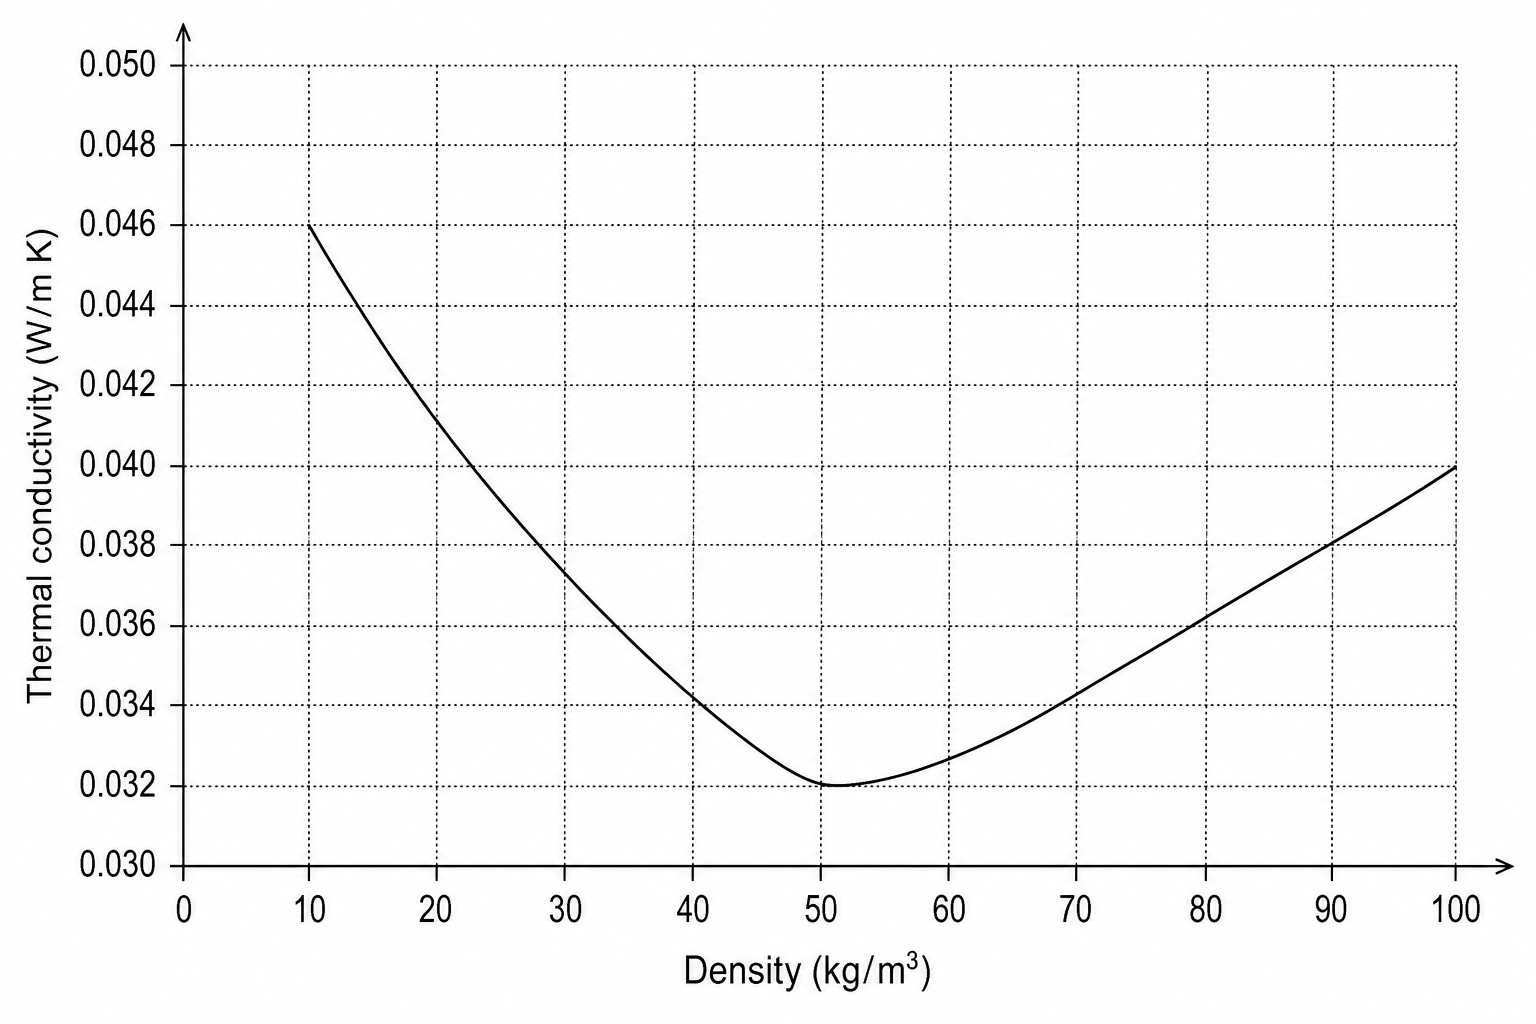
A line graph showing the relationship between thermal conductivity of glass wool on the y-axis (ranging from 0.030 to 0.050 W/m K) against its density on the x-axis (ranging from 0 to 100 kg/m³). The curve starts at a high thermal conductivity of 0.046 W/m K at a density of 10 kg/m³, decreases steadily to a minimum thermal conductivity of 0.032 W/m K at a density of 50 kg/m³, and then rises gradually to a thermal conductivity of 0.040 W/m K at a density of 100 kg/m³.

Using the graph in Figure 1, describe how the thermal conductivity of glass wool changes as its density increases from 10 kg/m3 to 100 kg/m3.

[2]

Energy stores, transfers and conservation Questions

  1. GCSE
  2. /Physics
  3. /Energy stores, transfers and conservation