5.6.1e The distance–time relationship
Representing motion on a distance–time graph
Definition
Distance–time graph
A distance–time graph shows how the distance travelled by an object changes with time.
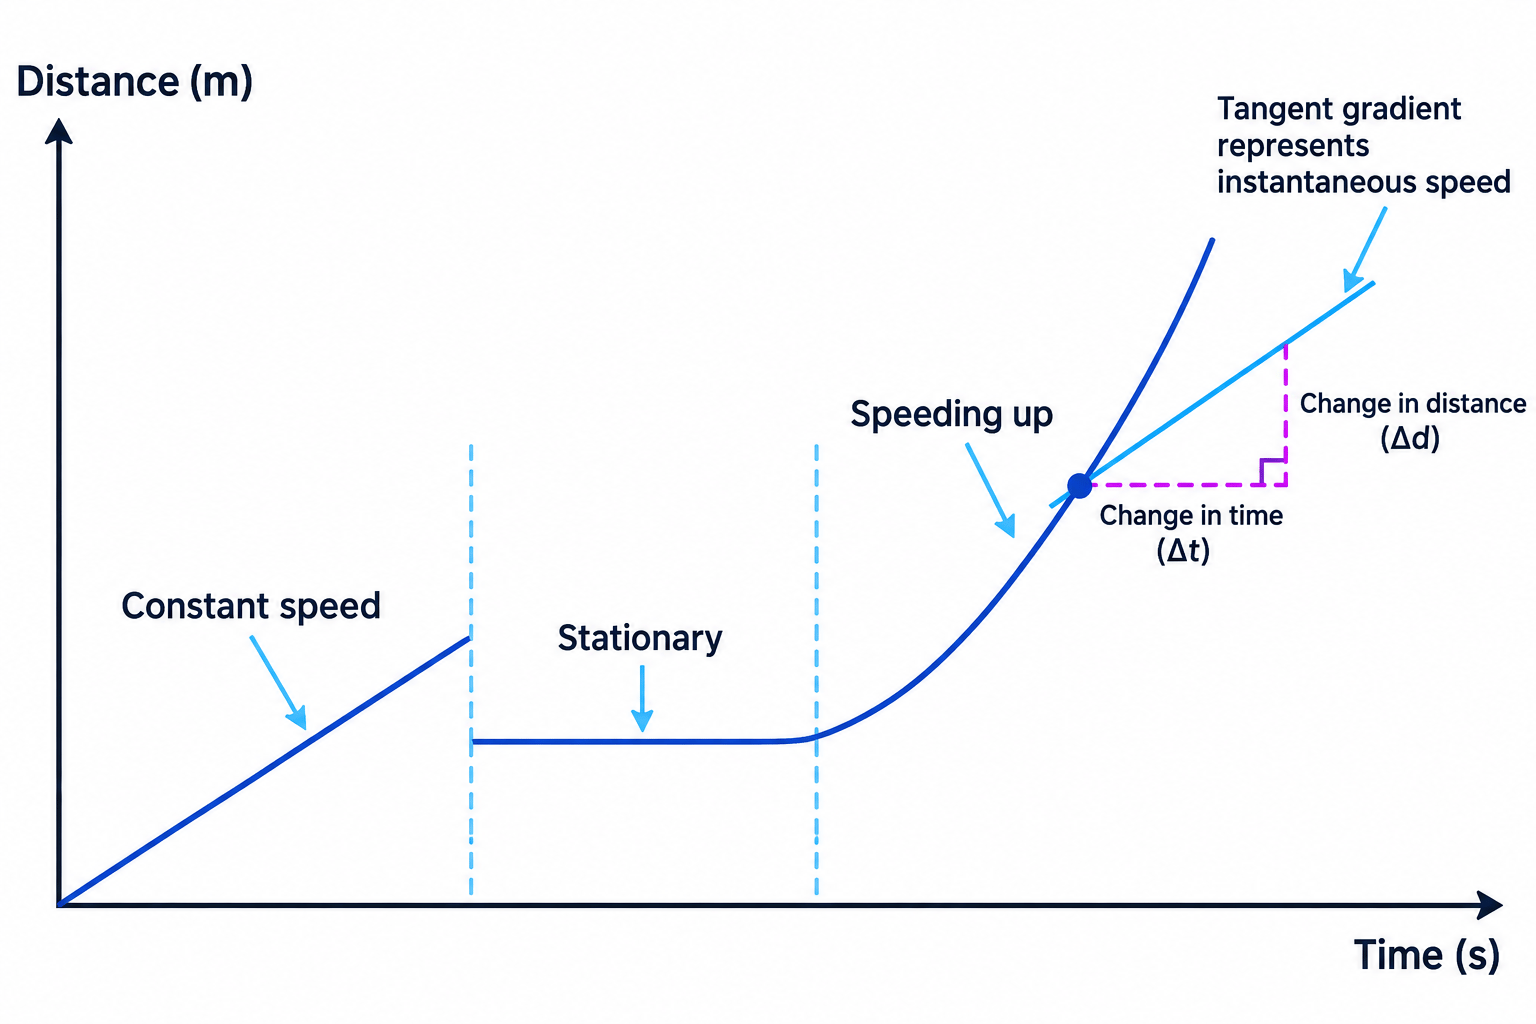
- For an object moving in a straight line, time is on the horizontal axis and distance on the vertical axis; each point gives the distance travelled by a given time.
- A straight, upward-sloping line shows constant speed.
- A horizontal line shows the object is stationary, because time passes but distance does not change.
- A steeper line shows a greater speed, because more distance is covered in the same time.
- A changing slope shows the object’s speed is changing.
- A line that slopes downwards (a negative gradient) shows the object moving back towards its starting point; the steeper the downward slope, the faster it is returning.
- A curve shows a changing speed, because the gradient is different at every point along it.
- A curve that gets steeper shows the object speeding up (accelerating), because the gradient, and so the speed, is increasing.
- A curve that gets less steep, flattening out, shows the object slowing down (decelerating), because the gradient, and so the speed, is decreasing.
Key Idea
On a distance–time graph, the gradient represents speed; the greater the gradient, the greater the speed.
Calculating speed from the gradient
Definition
Gradient
The gradient is the rate at which the vertical quantity changes compared with the horizontal quantity, found by dividing the vertical change by the horizontal change.
- The gradient of a distance–time graph is change in distancechange in time\dfrac{\text{change in distance}}{\text{change in time}}change in timechange in distance.
- Because speed = distance ÷ time, the speed equals the gradient of a distance–time graph.
- Distance in metres and time in seconds give speed in m/s\text{m/s}m/s; distance in kilometres and time in hours give km/h\text{km/h}km/h.
- To find a gradient, pick two points on the straight section, then find the change in distance (the rise) and the change in time (the run).
Example
- An object moves along a straight line. Between 4 s4\ \text{s}4 s and 10 s10\ \text{s}10 s, its distance increases from 12 m12\ \text{m}12 m to 30 m30\ \text{m}30 m. Calculate its speed.
- Write the equation: speed=change in distancechange in time\text{speed} = \dfrac{\text{change in distance}}{\text{change in time}}speed=change in timechange in distance.
- Find the change in distance: 30−12=18 m30 - 12 = 18\ \text{m}30−12=18 m.
- Find the change in time: 10−4=6 s10 - 4 = 6\ \text{s}10−4=6 s.
- Substitute the values: speed=18 m6 s\text{speed} = \dfrac{18\ \text{m}}{6\ \text{s}}speed=6 s18 m.
- Calculate the speed: speed=3 m/s\text{speed} = 3\ \text{m/s}speed=3 m/s.
Drawing a distance–time graph from measurements
- Measurements of distance and time can be turned into a graph.
- Put time on the horizontal axis and distance on the vertical axis.
- Label both axes with the quantity and unit.
- Choose sensible, even scales that use most of the grid.
- Plot each pair of measurements accurately and join the points with straight lines.
- For the data 0 m0\ \text{m}0 m at 0 s0\ \text{s}0 s, 6 m6\ \text{m}6 m at 2 s2\ \text{s}2 s, 6 m6\ \text{m}6 m at 5 s5\ \text{s}5 s and 14 m14\ \text{m}14 m at 7 s7\ \text{s}7 s, the line is horizontal between 2 s2\ \text{s}2 s and 5 s5\ \text{s}5 s, so the object is stationary for 3 s3\ \text{s}3 s.
- Between 5 s5\ \text{s}5 s and 7 s7\ \text{s}7 s the distance rises 8 m8\ \text{m}8 m in 2 s2\ \text{s}2 s, so the speed is 8 m2 s=4 m/s\dfrac{8\ \text{m}}{2\ \text{s}} = 4\ \text{m/s}2 s8 m=4 m/s.
Exam technique
Answering distance–time graph questions
- Do not confuse the height of a line with its gradient: a higher point means more distance travelled, not necessarily a greater speed.
- A horizontal line does not show a constant non-zero speed; it shows zero speed, because the distance is not changing.
- When finding a gradient, use the changes in distance and time; do not divide the final distance by the final time unless the section starts at the origin.
- Show the two subtractions for the changes, then the gradient equation, the substitution and the unit.
- When comparing speeds, refer to the slopes: “the line is steeper, so the speed is greater”.
Self review
- Which quantity is plotted on each axis of a distance–time graph?
- What does a horizontal line represent?
- Why does a steeper line represent a greater speed?
- How is speed calculated from the gradient?
- Why must you use changes in distance and time when finding a gradient?
5.6.1f Speed from a distance–time graph tangent (HT)
Speed and the gradient of a distance–time graph
Definition
Gradient
The gradient of a graph is the change in the vertical quantity divided by the change in the horizontal quantity.
- On a distance–time graph, the gradient represents the speed, speed=change in distancechange in time\text{speed}=\dfrac{\text{change in distance}}{\text{change in time}}speed=change in timechange in distance.
- A straight line has a constant gradient, so it represents an object moving at constant speed.
- A curved line has a changing gradient, so the object's speed is changing and the object is accelerating.
- Finding the gradient between two points on a curved graph gives the average speed over that time interval.
- To find the speed at one particular instant, you must draw a tangent to the curve.
Drawing a tangent to find instantaneous speed
Definition
Tangent
A tangent is a straight line drawn so that it touches a curve at the chosen point and has the same gradient as the curve at that point.
- The gradient of the tangent gives the object's speed at that moment, its instantaneous speed.
- Find the required time on the horizontal axis.
- Move vertically up from that time until you reach the curve.
- Using a ruler, draw a tangent to the curve at that point.
- Choose two points that are far apart on the tangent.
- Read off the change in distance and the change in time between them, then find the gradient, speed=change in distancechange in time\text{speed}=\dfrac{\text{change in distance}}{\text{change in time}}speed=change in timechange in distance.
- The two points must lie on the tangent, not necessarily on the original curve; points that are far apart give a large gradient triangle, which reduces the effect of small measurement errors.
Common Mistake
- Do not calculate total distancetotal time\dfrac{\text{total distance}}{\text{total time}}total timetotal distance from the origin to the point; for a curved graph this gives an average speed, not the speed at that instant.
- Do not use two points taken from the original curve unless they also lie on the tangent; the gradient must be found from points on the tangent line.
Example
- A student needs the speed of an accelerating object at 4.0 s4.0\ \text{s}4.0 s. A tangent drawn to the distance–time curve at 4.0 s4.0\ \text{s}4.0 s passes through the points time =2.0 s=2.0\ \text{s}=2.0 s, distance =5.0 m=5.0\ \text{m}=5.0 m and time =6.0 s=6.0\ \text{s}=6.0 s, distance =17.0 m=17.0\ \text{m}=17.0 m.
- Change in distance =17.0−5.0=12.0 m=17.0-5.0=12.0\ \text{m}=17.0−5.0=12.0 m.
- Change in time =6.0−2.0=4.0 s=6.0-2.0=4.0\ \text{s}=6.0−2.0=4.0 s.
- Find the gradient: speed=12.04.0\text{speed}=\dfrac{12.0}{4.0}speed=4.012.0.
- Answer: 3.0 m/s3.0\ \text{m/s}3.0 m/s.
Exam technique
- Show both subtractions clearly and state the gradient as gradient=y2−y1x2−x1\text{gradient}=\dfrac{y_2-y_1}{x_2-x_1}gradient=x2−x1y2−y1.
- A range of answers is usually accepted because drawing a tangent involves judgement, but your numbers must match the tangent on your graph.
Why your answer is an estimate
- Because different students may draw slightly different but valid tangents, the calculated speed is usually an estimate.
- Any answer within the accepted range is credited, provided the working matches the tangent that has been drawn.
Self review
- What does the gradient of a distance–time graph represent?
- What does a curved distance–time graph tell you about the motion?
- How do you find the speed at one particular instant?
- Which two points should you use to calculate the gradient of a tangent?
- What is the usual unit of speed?