Reading a distance–time graph
Reading a distance–time graph
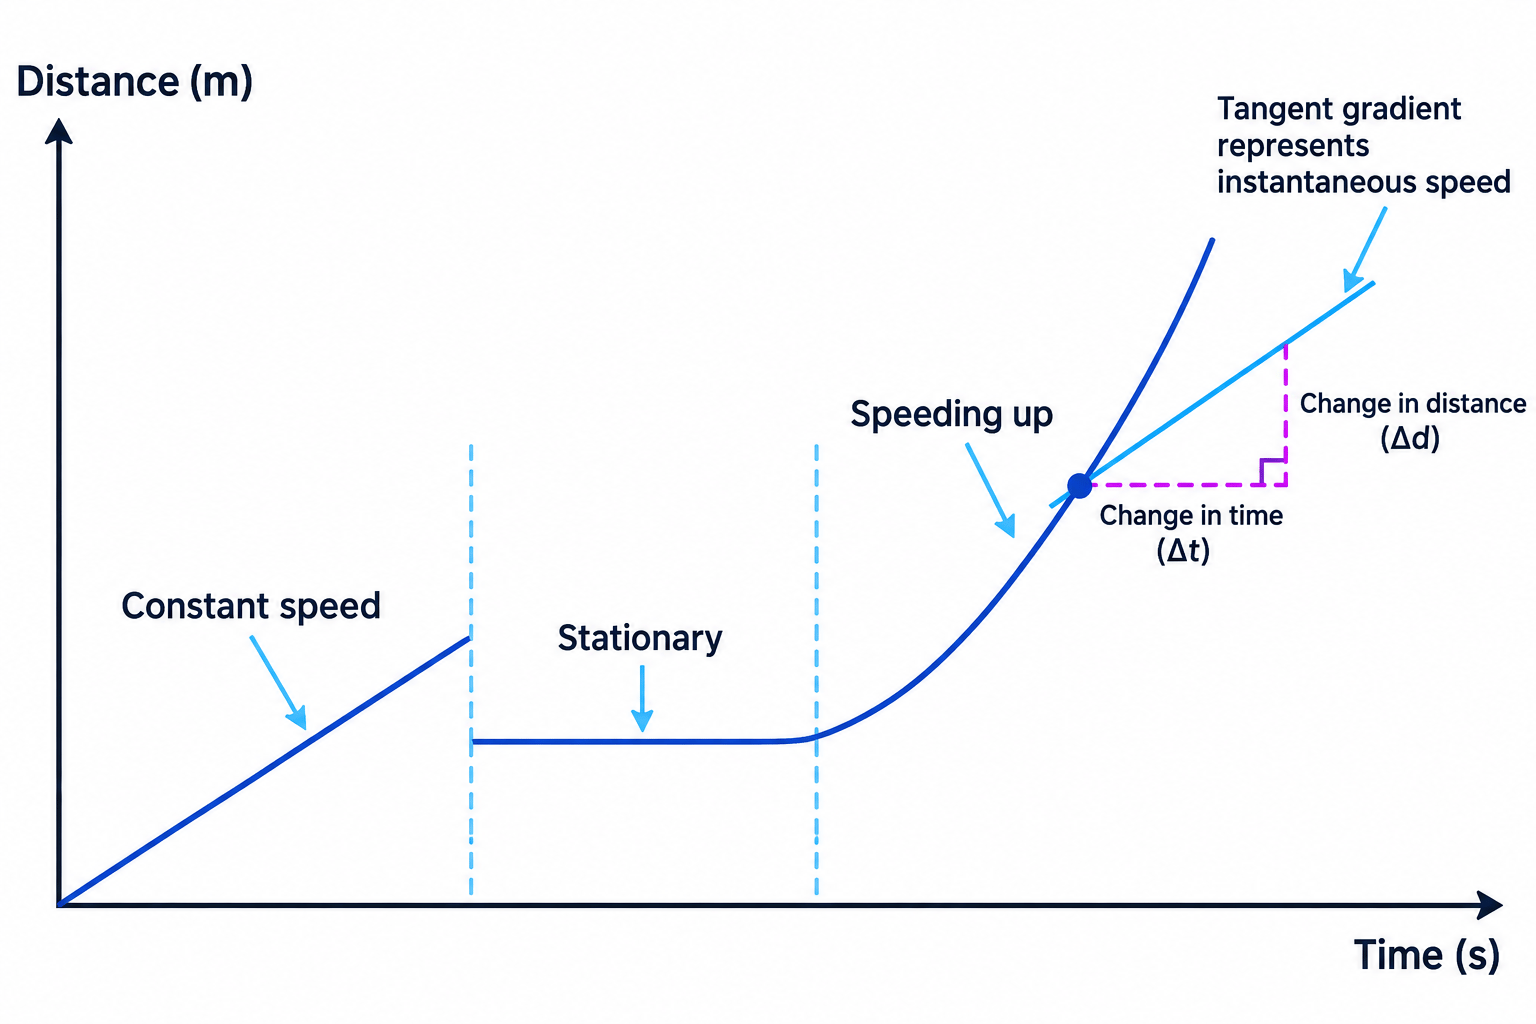
A distance–time graph shows how the distance travelled changes as time passes. Time is plotted on the horizontal axis, and distance is plotted on the vertical axis.
Reading a distance–time graph
Reading a distance–time graph
A distance–time graph shows how the distance travelled changes as time passes. Time is plotted on the horizontal axis, and distance is plotted on the vertical axis.