Question 10
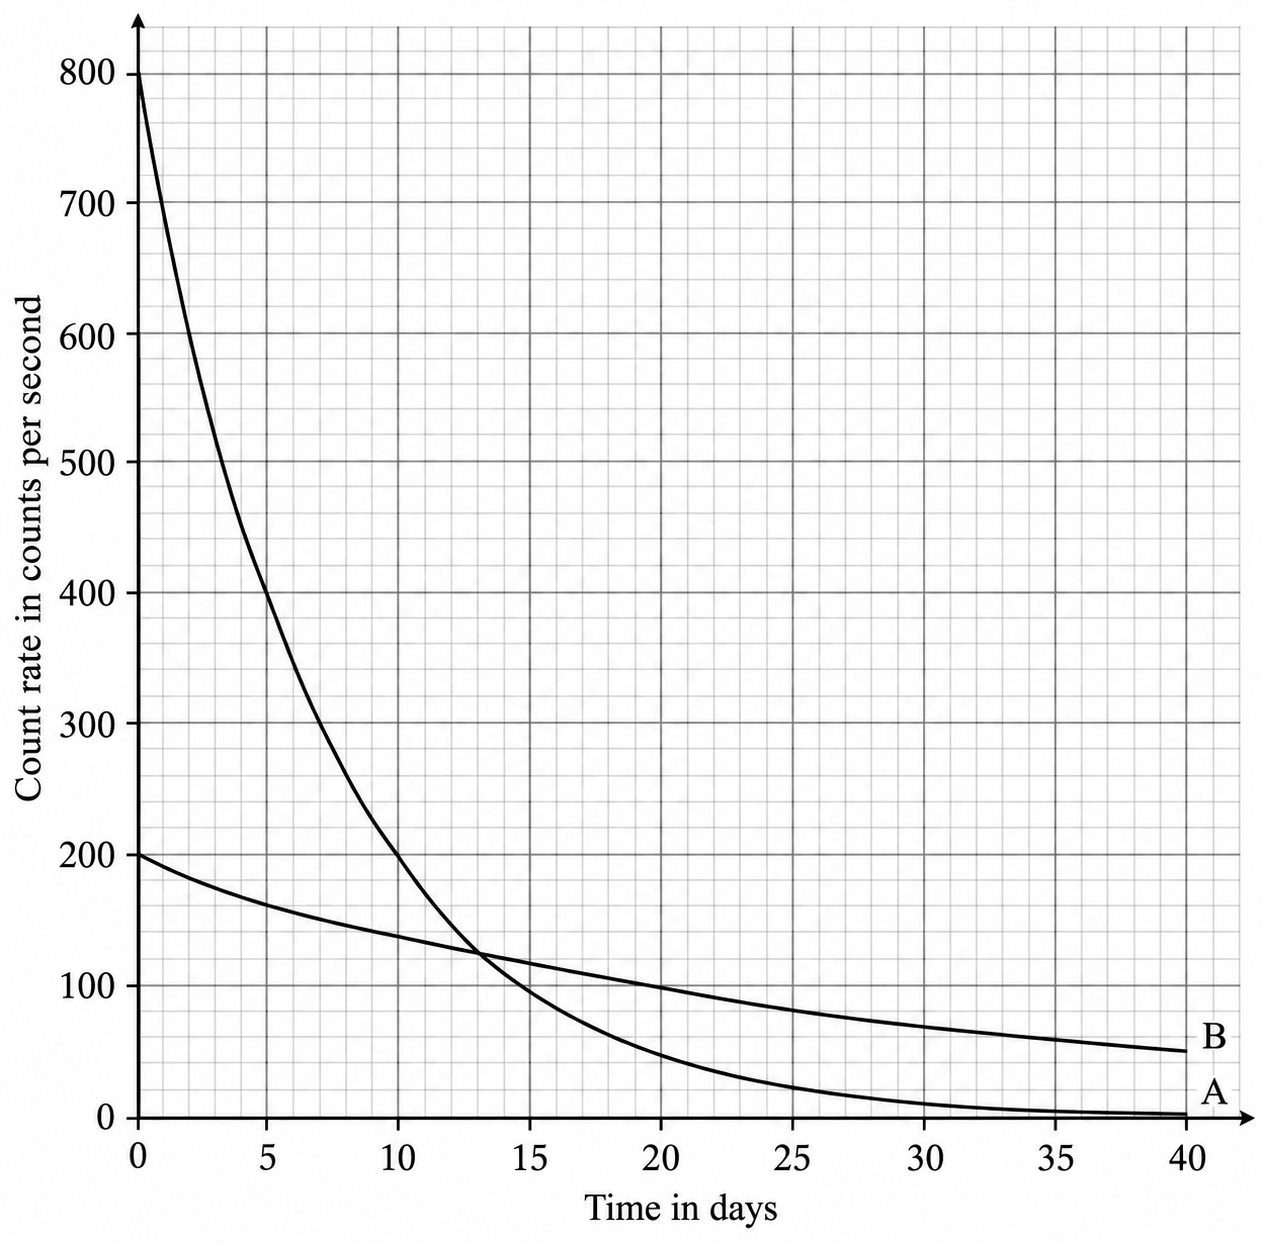
HTwo sealed sources, A and B, contained equal numbers of undecayed nuclei at the start of an investigation. Figure shows how the count rate from each source changed over 40 days.
Figure: How the count rate from source A and from source B changed over 40 days
a.[2]
Use Figure to determine the half-life of source A.
b.[1]
Use Figure to determine the half-life of source B.
c.[2]
The two sources contained equal numbers of undecayed nuclei at the start. Explain why the initial count rate from source A was higher than the initial count rate from source B.
d.[2]
Calculate the net decline in the count rate from source A between 0 days and 20 days. Give your answer as a ratio.
4.2 Atoms and nuclear radiation Questions
40 exam-style questions on AQA GCSE Physics 4.2 Atoms and nuclear radiation, covering 4.2.1 Radioactive decay and nuclear radiation, 4.2.2 Nuclear equations, 4.2.3 Half-lives and the random nature of radioactive decay, and 4.2.4 Radioactive contamination. Each one has a worked solution and a mark scheme showing where the marks go.