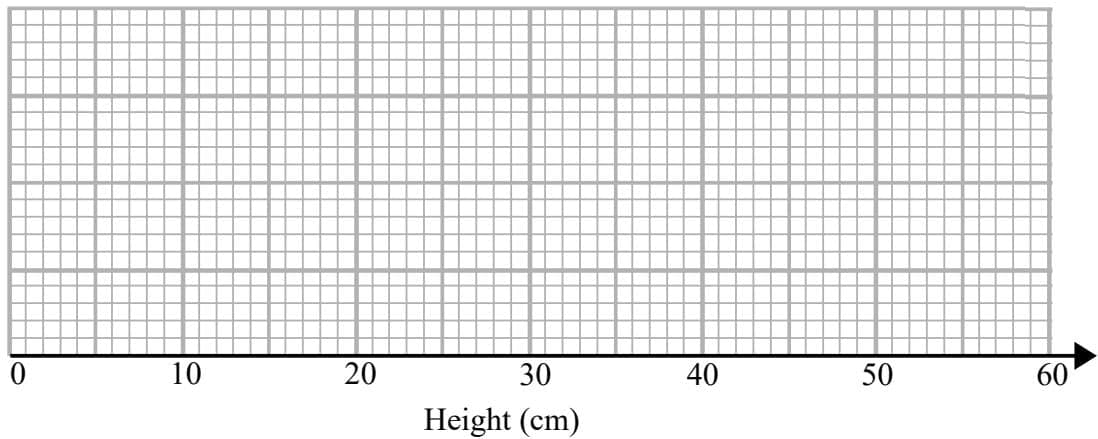
The table shows some information about the heights, in cm, of some plants.
| Minimum | Lower Quartile | Median | Upper Quartile | Maximum |
|---|---|---|---|---|
| 10 | 17 | 24 | 33 | 51 |
Draw a box plot for this information.
Expand and Simplify (x−2)(x+3)(x−4)(x - 2)(x + 3)(x - 4)(x−2)(x+3)(x−4)
Write 3.24˙5˙3.2\dot{4}\dot{5}3.24˙5˙ as a fraction in its simplest form.
Find the equation of the line perpendicular to 5y−4x=65y - 4x = 65y−4x=6 which passes through (0,7)
Find the value of (27x9)23\displaystyle (27 x^9)^{\frac{2}{3}}(27x9)32
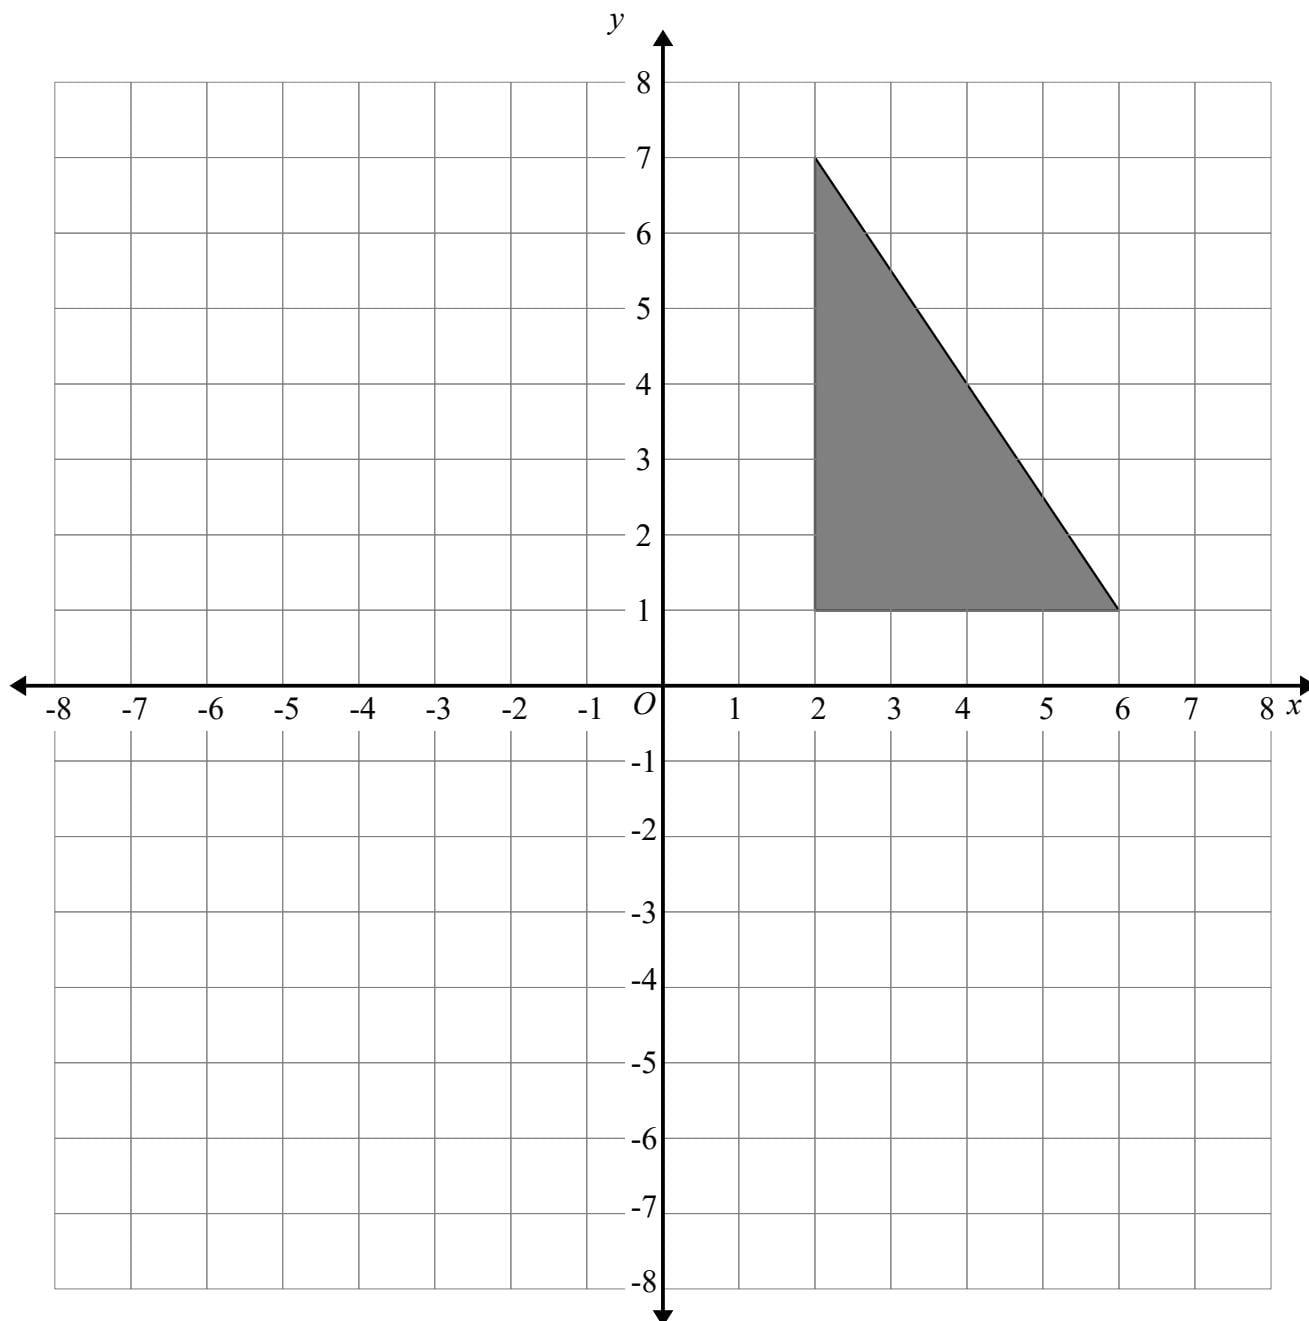
On the grid, enlarge the triangle by scale factor -0.5, centre OOO.
The cumulative frequency table shows the height, in cm, of some tomato plants.
| Height | Cumulative Frequency |
|---|---|
| 140<h≤150140 < h \leq 150140<h≤150 | 9 |
| 140<h≤160140 < h \leq 160140<h≤160 | 19 |
| 140<h≤170140 < h \leq 170140<h≤170 | 36 |
| 140<h≤180140 < h \leq 180140<h≤180 | 48 |
| 140<h≤190140 < h \leq 190140<h≤190 | 55 |
| 140<h≤200140 < h \leq 200140<h≤200 | 60 |
On the grid, plot a cumulative frequency graph for this information.
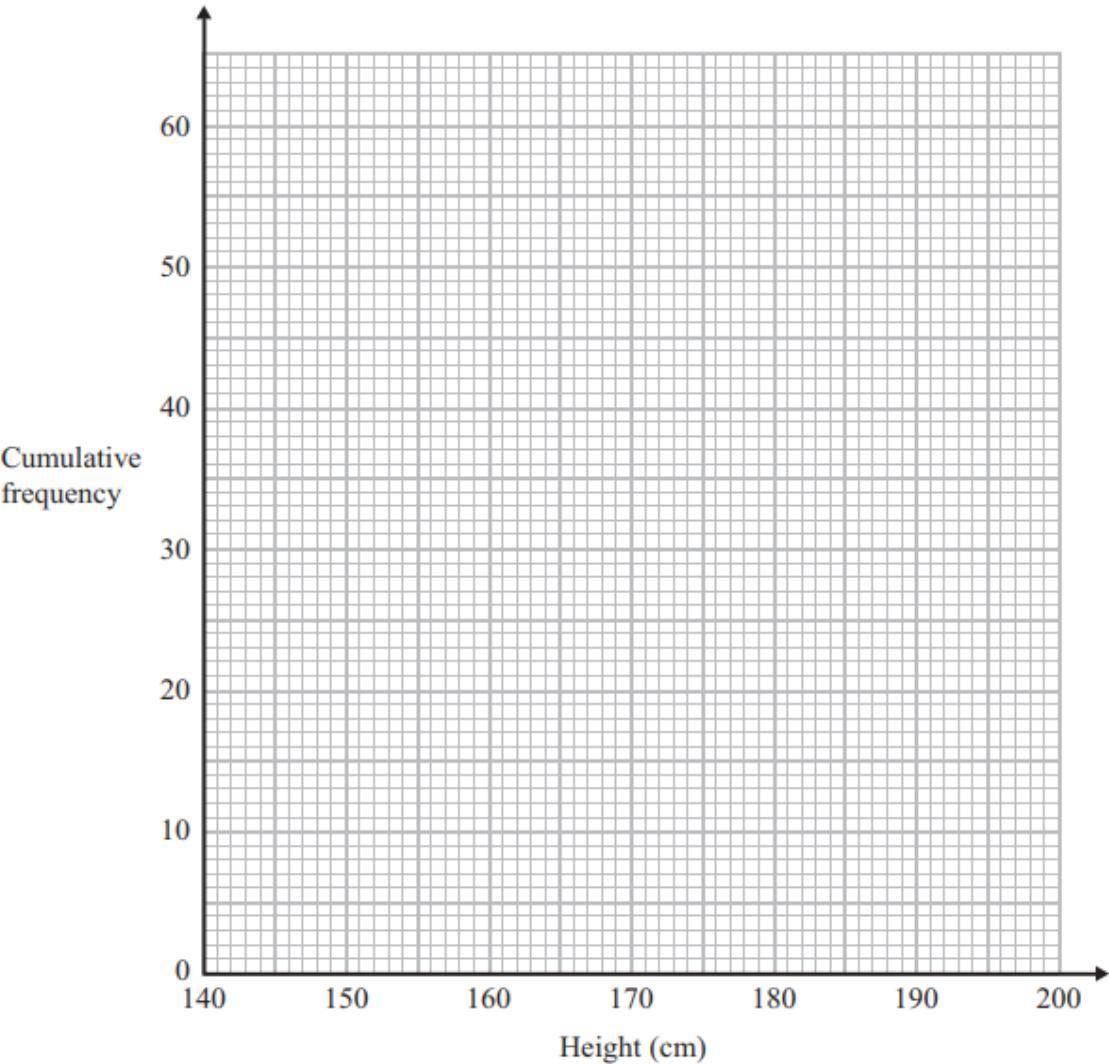
Estimate the median height.
Make x x\,x the subject of the formula ab=xx−5\displaystyle \frac{a}{b} = \frac{x}{x - 5}ba=x−5x
Write (4−3)2(4 - \sqrt{3})^{2}(4−3)2 in the form a+b3a + b\sqrt{3}a+b3, where a a\,a and b b\,b are integers.
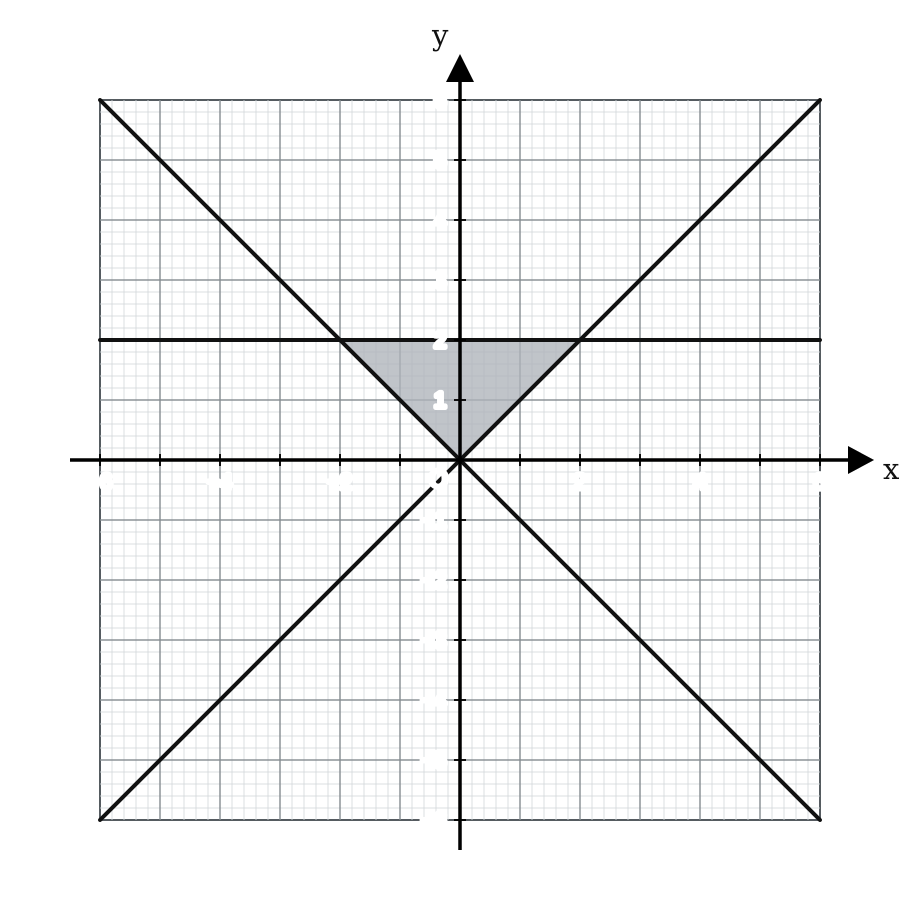
Write down the three inequalities that define the shaded region

