Question 9
An athlete is running a training drill. The speed-time graph for the run is shown below.
- The athlete accelerates from rest to 10 m/s in 10 seconds10\text{ seconds}10 seconds.
- The athlete maintains this speed of 10 m/s for 50 seconds50\text{ seconds}50 seconds.
- The athlete then slows down to a stop at time T secondsT\text{ seconds}T seconds.
The total distance of the drill is 0.8 km.
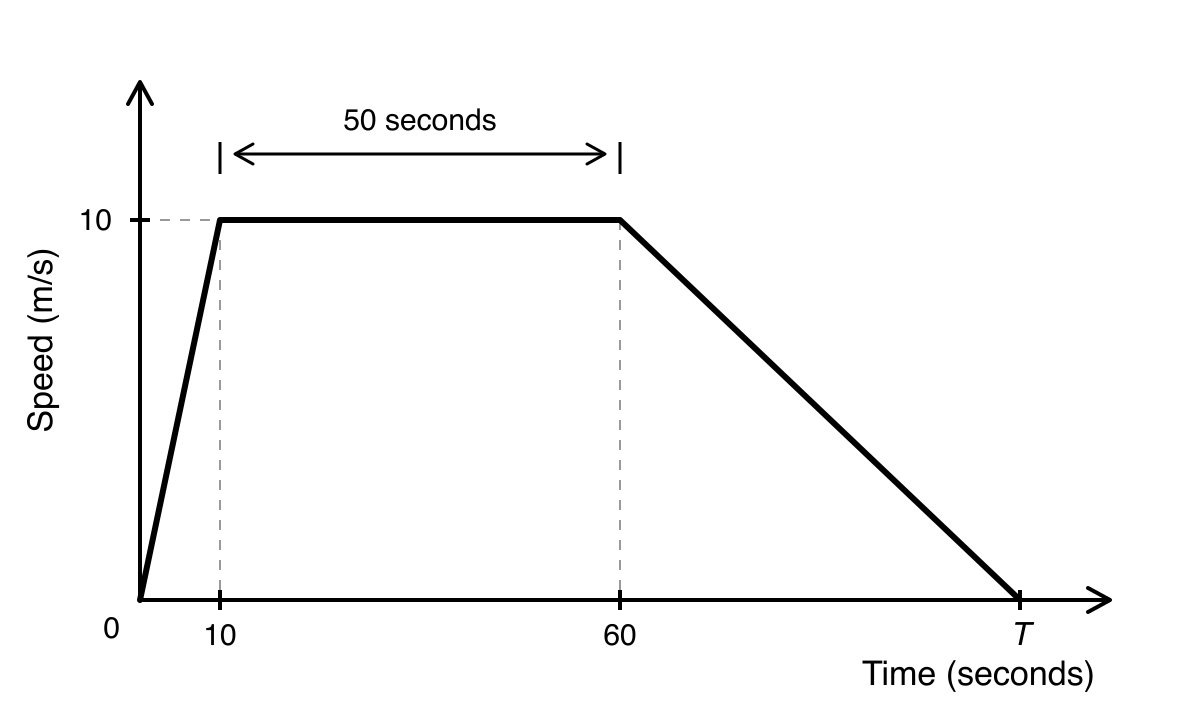
Work out the value of TTT.
Velocity Time Graphs Questions
23 exam-style questions on Edexcel GCSE Maths Velocity Time Graphs. Each one has a worked solution and a mark scheme showing where the marks go.