Skip to content

Course home

Velocity Time Graphs

Velocity Time Graphs

MediumHard
1234567891011
Question 9

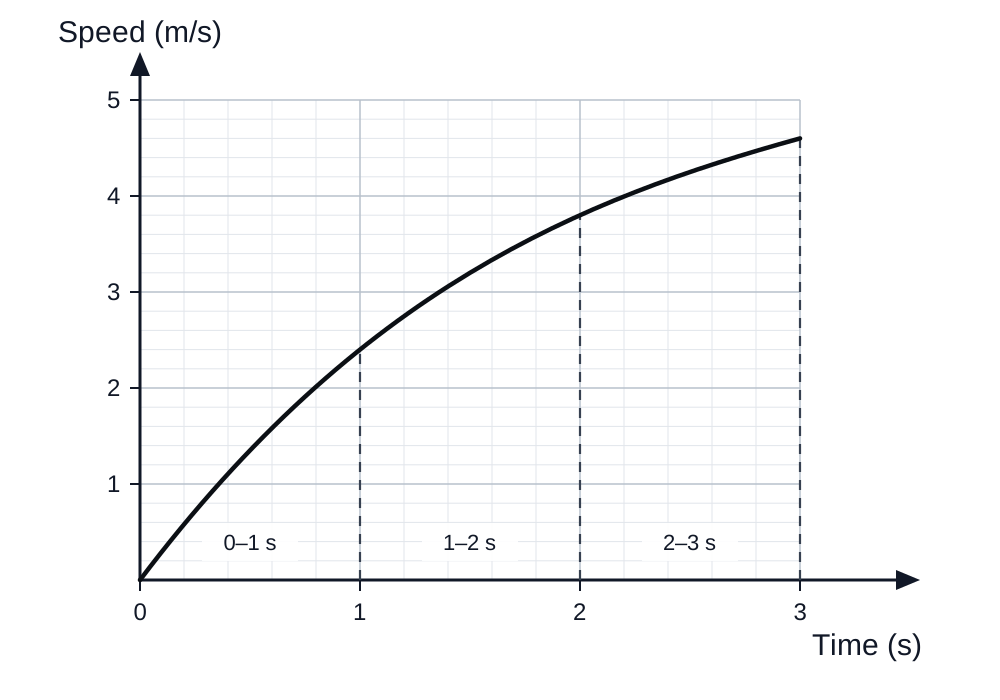
The speed-time graph for a runner during a short sprint is shown.

A speed-time graph on a grid showing speed in m/s over 3 seconds.

a.

Use 3 strips of equal width to find an estimate for the area under the graph for the first 3 seconds.

[3]
b.

Describe what your answer to part a represents.

[1]
Markscheme

Velocity Time Graphs Questions

  1. GCSE
  2. /Maths
  3. /Velocity Time Graphs

23 exam-style questions on Edexcel GCSE Maths Velocity Time Graphs. Each one has a worked solution and a mark scheme showing where the marks go.

Question bank