Question 1
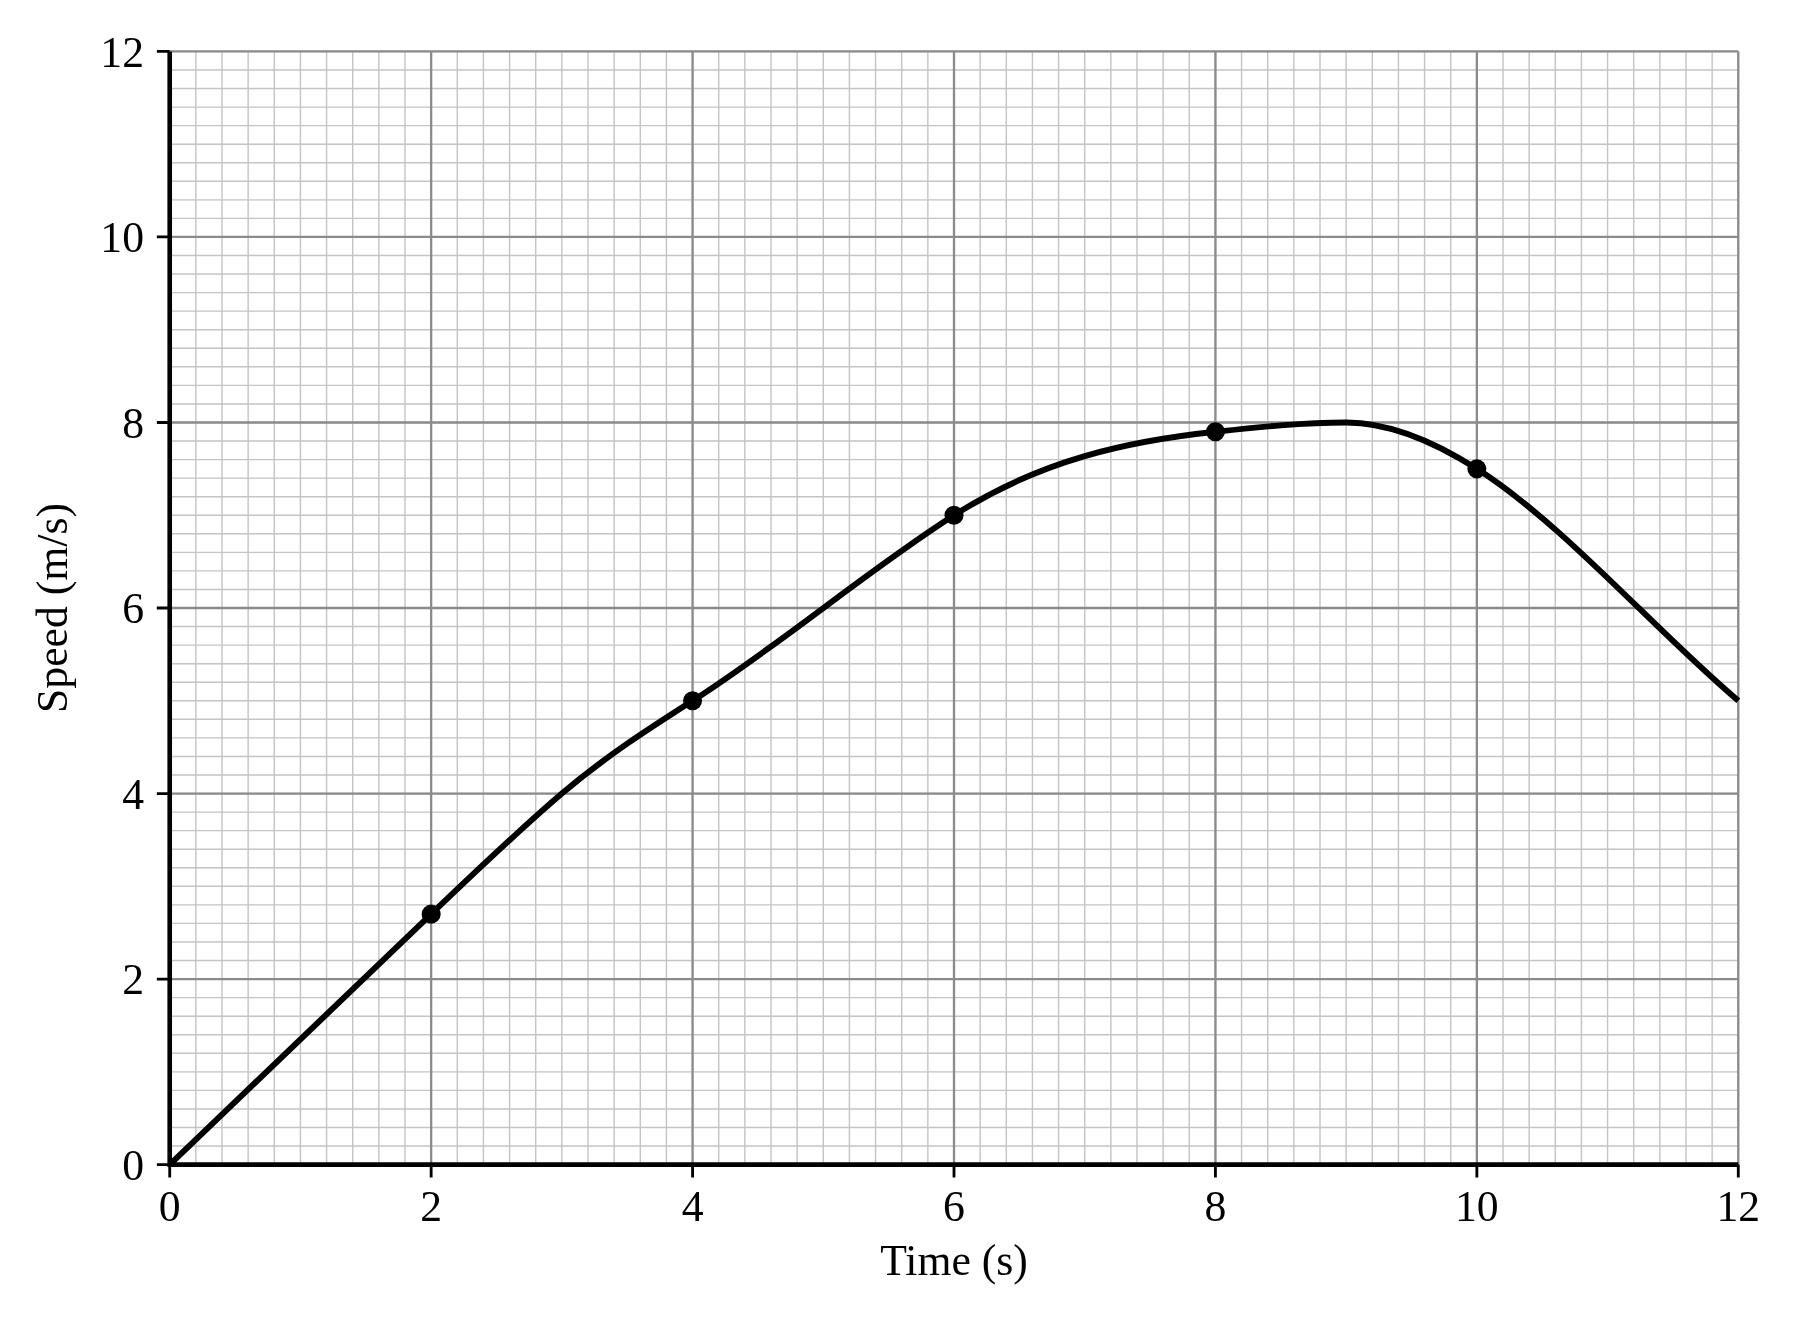
The speed-time graph below represents the motion of a cyclist during a 12-second sprint.
a.[2]
Work out an estimate for the acceleration of the cyclist when t=6t = 6t=6.
b.[3]
Use 4 strips of equal width to find an estimate for the distance travelled by the cyclist in 12 seconds.
Velocity Time Graphs Questions
23 exam-style questions on Edexcel GCSE Maths Velocity Time Graphs. Each one has a worked solution and a mark scheme showing where the marks go.