Question 4
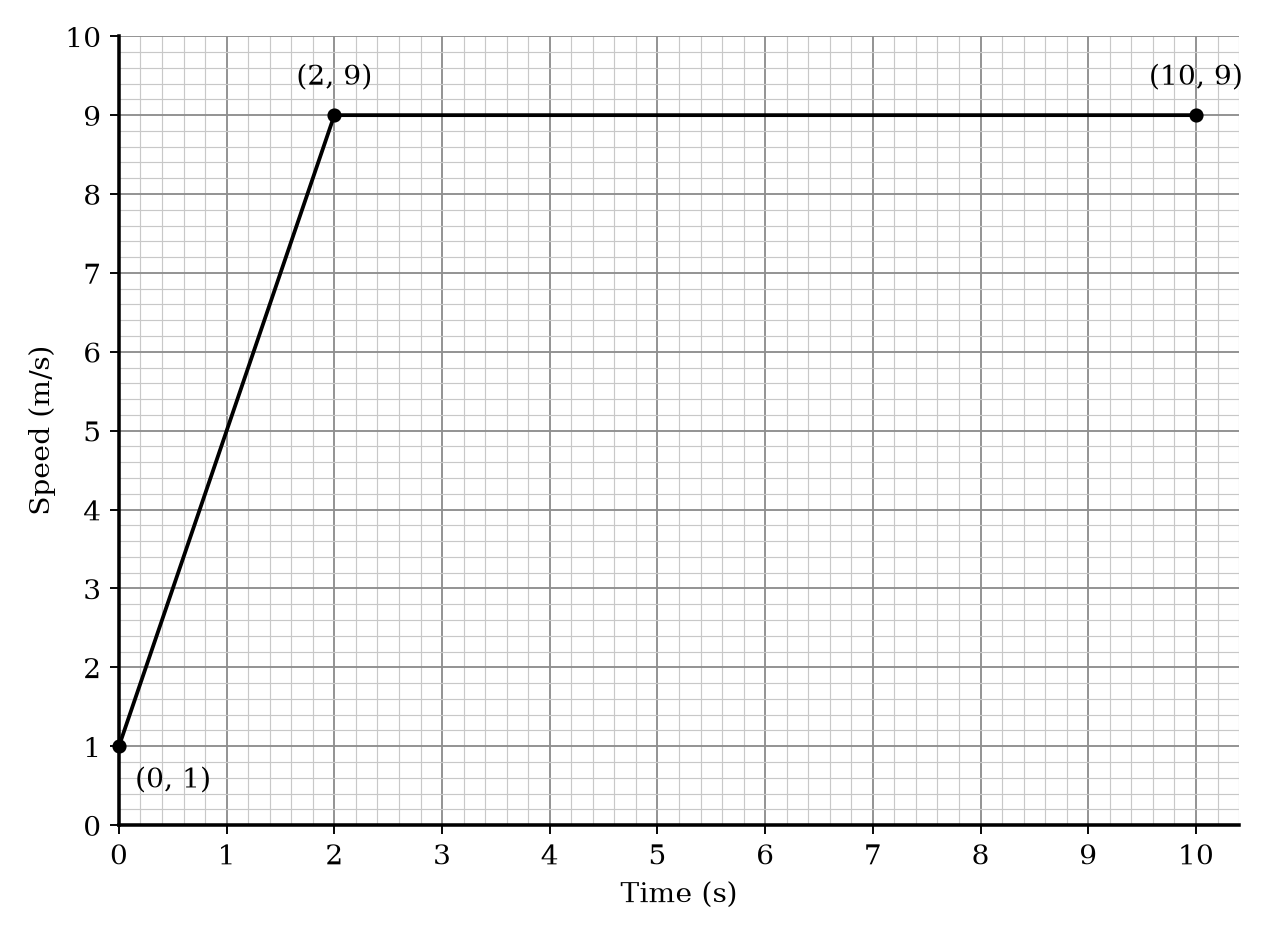
58%The following speed-time graph represents a sprinter running in a straight line for 10 seconds. The sprinter increases their speed from 1 ms-1 to 9 ms-1 during the first 2 seconds, and then runs at a constant speed of 9 ms-1 for the next 8 seconds.
a.[2]
Work out the acceleration for the first 2 seconds.
b.[2]
Calculate the total distance covered by the sprinter.
Velocity Time Graphs Questions
23 exam-style questions on AQA GCSE Maths Velocity Time Graphs. Each one has a worked solution and a mark scheme showing where the marks go.