Question 5
A cyclist completes a leg of a race. The speed-time graph for the journey is shown below.
- The cyclist accelerates uniformly from rest to 8 m/s in 20 seconds20\text{ seconds}20 seconds.
- They maintain a constant speed of 8 m/s until 100 seconds100\text{ seconds}100 seconds.
- They then decelerate uniformly until coming to rest at time T secondsT\text{ seconds}T seconds.
The total distance covered by the cyclist is 1.2 km.
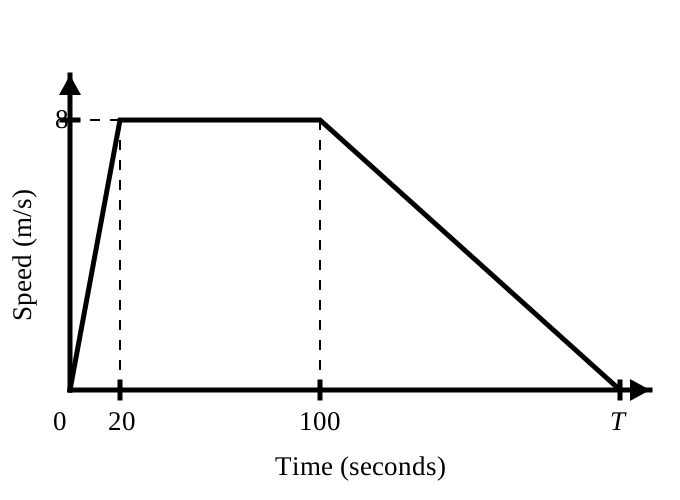
Work out the value of TTT.
Velocity Time Graphs Questions
23 exam-style questions on AQA GCSE Maths Velocity Time Graphs. Each one has a worked solution and a mark scheme showing where the marks go.