What you'll learn
- How the UK's age and sex structure has changed from 1900 to the present day.
- How the UK has moved through the Demographic Transition Model.
- Why the UK has an ageing population, and the effects and responses.
- The main 21st-century immigration flows into the UK and their social and economic impacts.
The starting point: what is population structure?
A population is the number of people living in a place. For this topic, the place is mainly the UK at the national scale, but you should also think locally: your town, ward, borough or county may be very different from the national average.
A birth rate is the number of live births per 1,000 people per year. A death rate is the number of deaths per 1,000 people per year. Natural increase happens when births are higher than deaths; natural decrease happens when deaths are higher than births.
natural change=birth rate−death rate\text{natural change} = \text{birth rate} - \text{death rate}natural change=birth rate−death rateA fertility rate is the average number of children a woman is expected to have. A life expectancy is the average number of years a newborn baby is expected to live if current death rates continue.
Population structure
Population structure means how a population is made up, especially by age and sex. It matters because different age groups need different services, such as schools, jobs, housing, healthcare and pensions.
How the UK's population structure has changed since 1900
In 1901, the UK had about 38 million people. By the early 2020s, it had around 67 million. The exact figure depends on the year and data source, but the long-term trend is clear: the UK has grown and become older.
In the early 1900s, the UK had a more youthful structure. There were many children, fewer people survived into old age, and infectious diseases were more dangerous. Today, birth rates are lower, families are smaller, healthcare is better, and many more people live into their 70s, 80s and beyond.
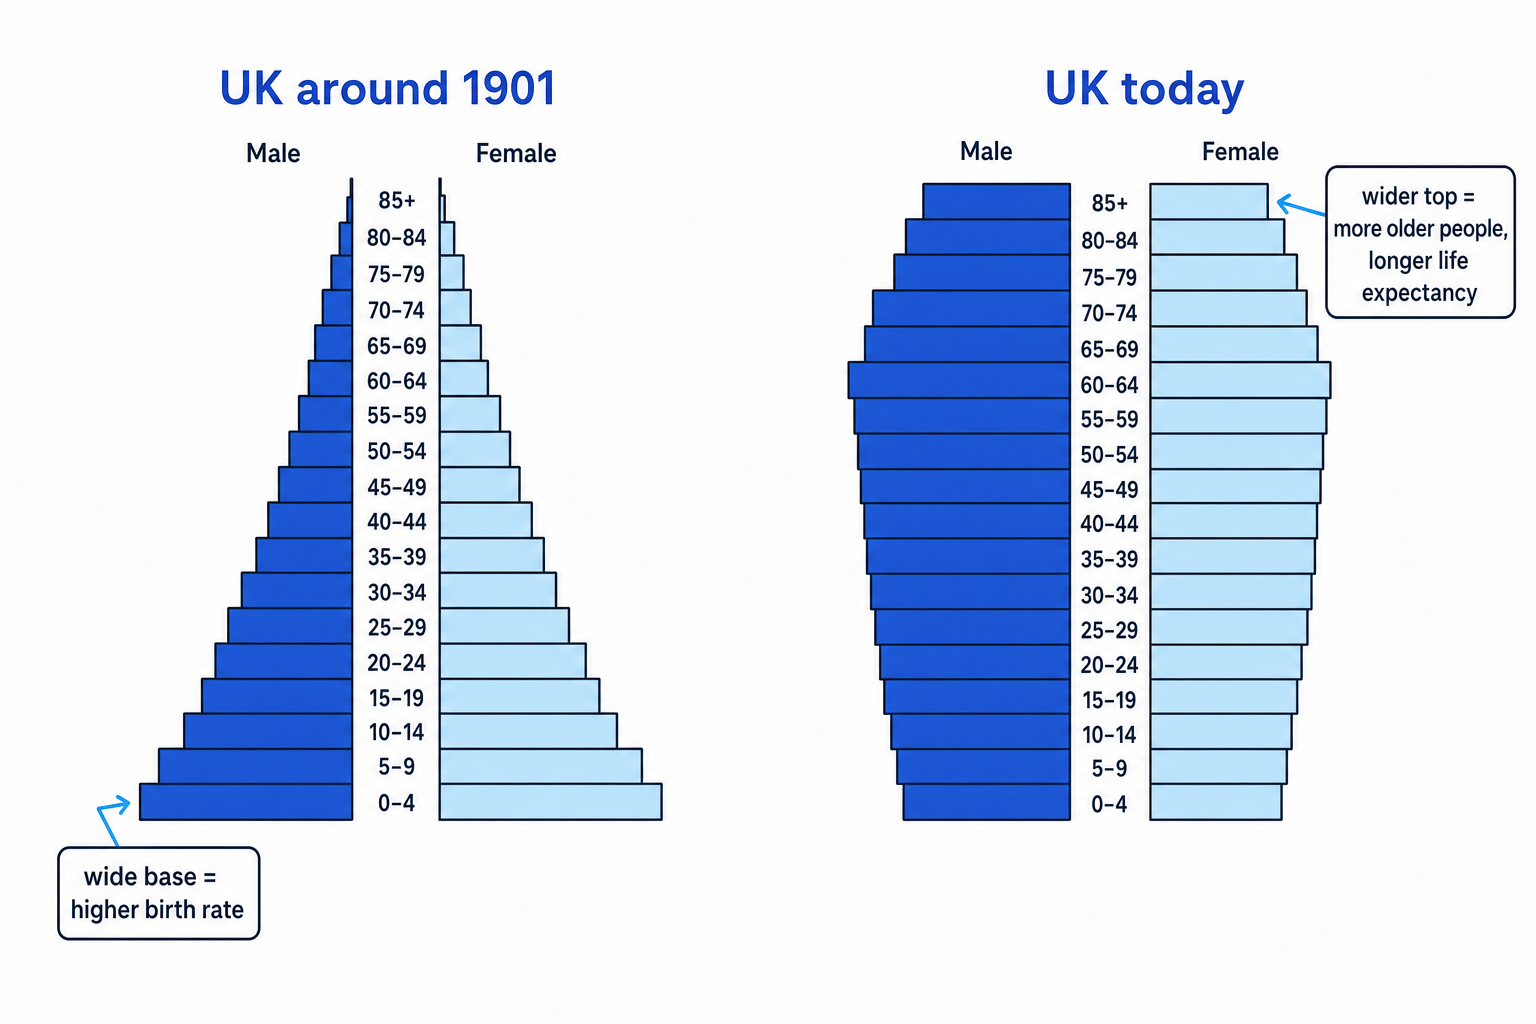
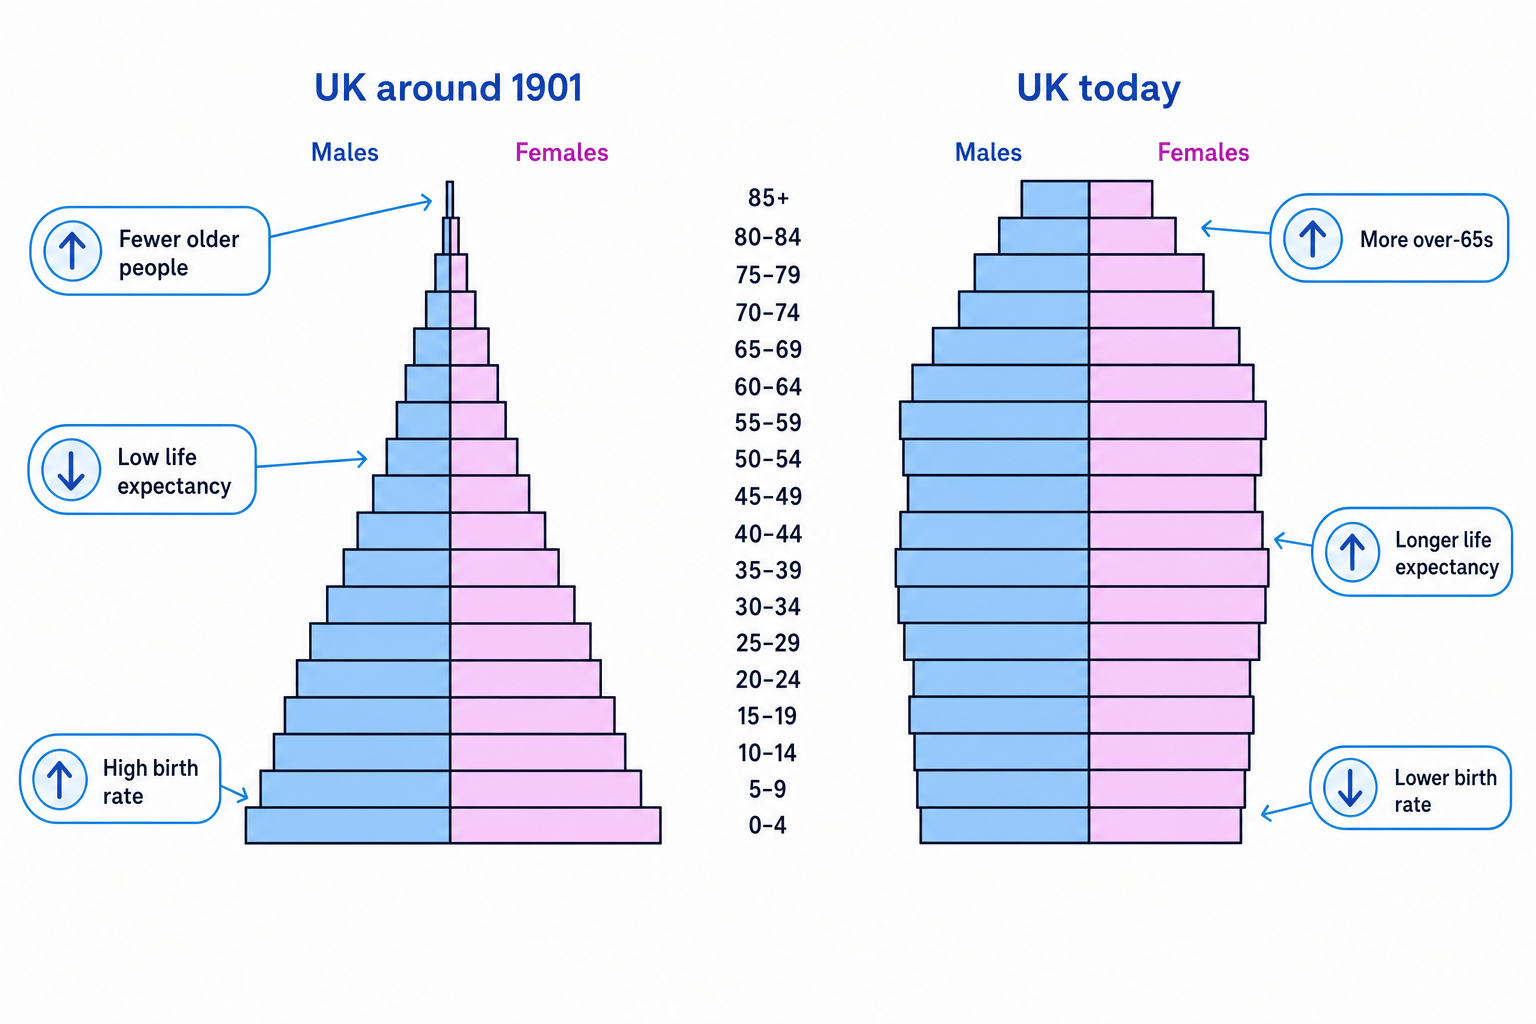
A population pyramid is a graph showing the age and sex structure of a population. Males are usually shown on the left, females on the right, and age groups run from youngest at the bottom to oldest at the top. The two shapes below show the main change: from a wide-based pyramid to a more rectangular, ageing structure.
Interpreting a changing population pyramid
-
Compare the base of each pyramid. The 1901 pyramid has a much wider base, so it suggests a higher birth rate and a larger share of children.
-
Compare the top of each pyramid. The modern pyramid has a wider top, so a larger share of people are surviving to older ages.
-
Compare the overall shape. The 1901 shape narrows quickly with age, suggesting lower life expectancy, while the modern shape is more rectangular, showing longer survival through adulthood.
-
Link the shape to services. A youthful structure increases demand for schools and child health services, while an older structure increases demand for healthcare, pensions, social care and accessible housing.
The long-term pattern
The UK's population has not just got larger; it has become older, with a smaller proportion of children and a much larger proportion of over-65s than in 1900.
The UK and the Demographic Transition Model
The Demographic Transition Model, often shortened to DTM, is a model showing how birth rates, death rates and total population tend to change as a country develops economically and socially.
Demographic Transition Model
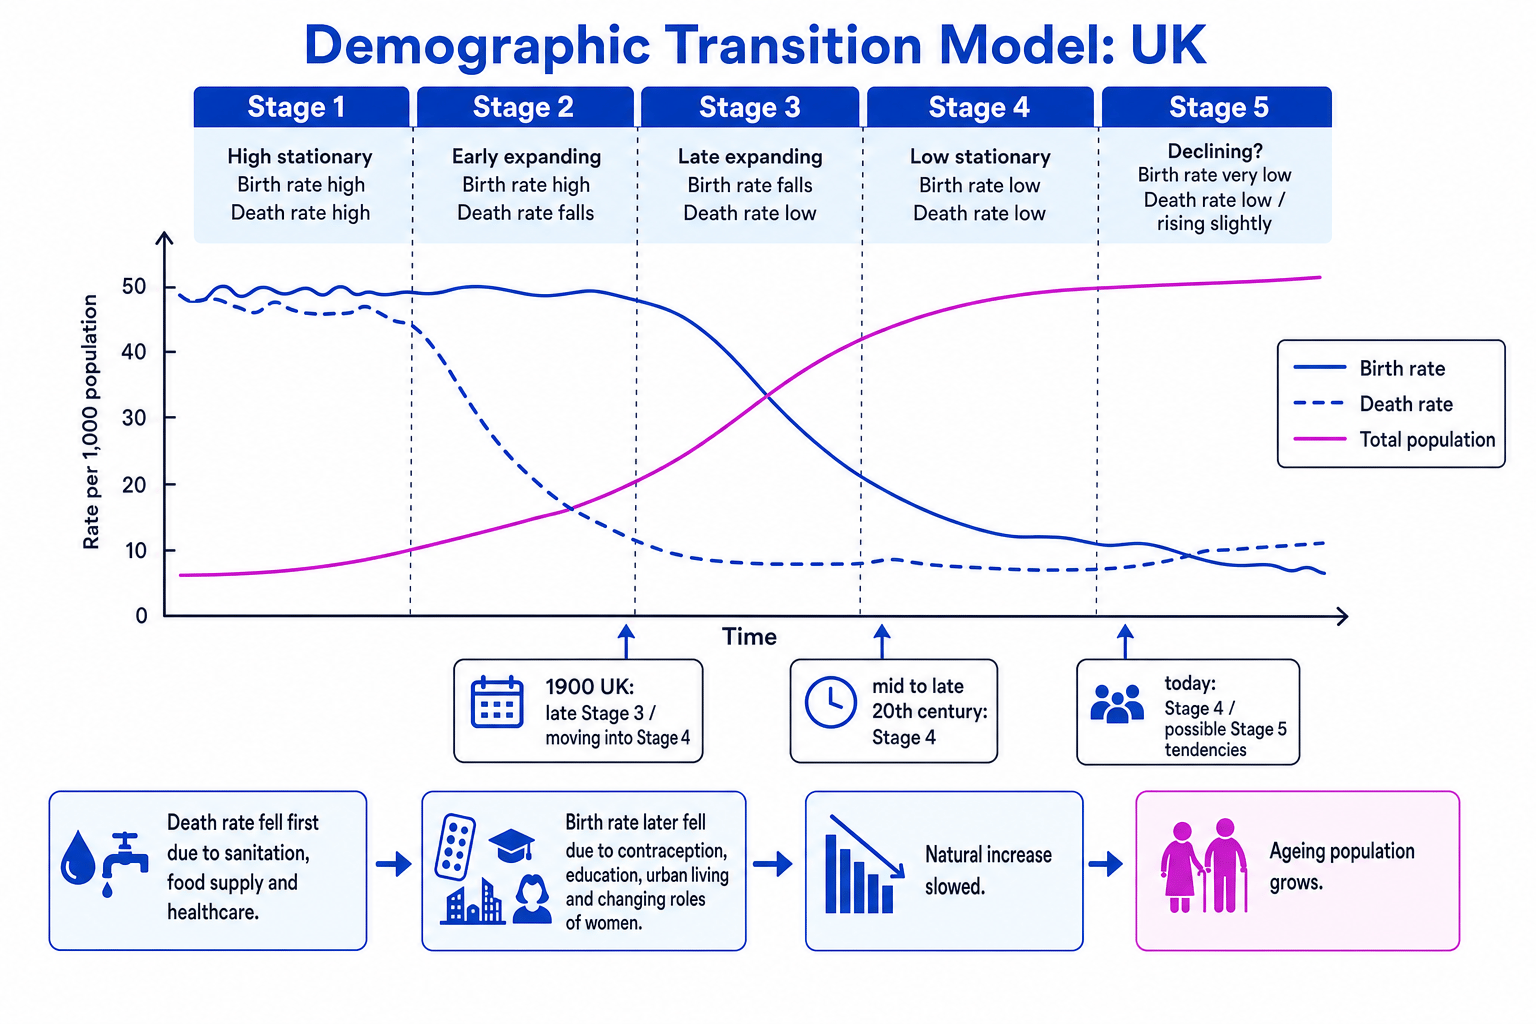
The DTM is a simplified model with stages. It shows death rates falling first, then birth rates falling later, causing rapid population growth followed by slower growth and eventually low growth.
The UK was one of the first countries to move through the DTM because it industrialised early. Before industrialisation, both birth and death rates were high. During the Industrial Revolution and after, death rates fell because of improvements in food supply, sanitation, clean water and medicine. Birth rates later fell as contraception, education, urban living, changing roles of women and the cost of raising children reduced family size.
Around 1900, the UK was in late Stage 3 or moving towards Stage 4: birth rates had started to fall, death rates were already lower, and population was still increasing. In the mid to late 20th century, the UK was mainly Stage 4, with both birth and death rates low. Today, the UK is usually seen as Stage 4, with possible Stage 5 tendencies because fertility is low and the population is ageing.
Locating the UK on the DTM
-
Compare birth and death rates. If both are low, the country is unlikely to be in Stage 2 or early Stage 3, where one or both rates are still high.
-
Check the population trend. If population is growing slowly rather than rapidly, this supports Stage 4 rather than Stage 3.
-
Add age-structure evidence. A high and rising share of over-65s suggests the UK may show Stage 5 tendencies, even if total population is still growing because of migration.
Using the DTM too literally
The DTM is a model, not a perfect timeline. It focuses on births and deaths, so it does not fully explain migration, government policy, economic shocks or events such as pandemics.
Why is the UK ageing?
An ageing population is a population where the proportion of older people is increasing. In the UK, this mainly means a growing share of people aged 65 and over.
The main causes are:
- Longer life expectancy: better healthcare, vaccinations, safer work, improved diets, clean water and better housing mean more people survive into old age.
- Lower fertility: many people have fewer children due to contraception, later marriage, higher housing and childcare costs, women staying longer in education and work, and changing social attitudes.
- The baby boom generation ageing: people born after the Second World War are now reaching older age groups.
- Local migration patterns: some younger adults move to cities for university and jobs, while some older people move to coastal or rural retirement areas such as parts of Devon, Dorset and Norfolk.
A dependent population is the part of the population often assumed to rely more on the working-age population. At GCSE, this is usually children and older people. The old-age dependency ratio compares older people with the working-age population.
old-age dependency ratio=population aged 65 and overpopulation aged 16 to 64×100\text{old-age dependency ratio} = \frac{\text{population aged 65 and over}}{\text{population aged 16 to 64}} \times 100old-age dependency ratio=population aged 16 to 64population aged 65 and over×100Calculating old-age dependency ratio
-
Choose the two groups being compared. Suppose a UK-style dataset has 12.5 million people aged 65 and over, and 42.0 million people aged 16 to 64.
-
Substitute the values into the formula: 12.542.0×100≈29.8\frac{12.5}{42.0} \times 100 \approx 29.842.012.5×100≈29.8.
-
Interpret the result. There are about 30 people aged 65 and over for every 100 people of working age, suggesting pressure on pensions, healthcare and social care.
Assuming all older people are dependent
Many over-65s work, volunteer, care for grandchildren and contribute taxes and spending. The dependency ratio is useful, but it simplifies real life.
Effects of an ageing population
At the national scale, ageing can increase pressure on the NHS, adult social care and the State Pension. More older people may mean higher public spending, and a smaller proportion of working-age people may mean fewer taxpayers per pensioner.
There can also be labour shortages if many workers retire and not enough younger workers replace them. This is important in sectors such as healthcare, care work, construction and transport.
But ageing is not only negative. Older people contribute through paid work, volunteering, family care and spending. The grey pound means the spending power of older people, which supports businesses such as tourism, leisure, healthcare and home adaptations.
At the local scale, impacts vary. A coastal town with many retired residents may need more GP surgeries, accessible buses, care homes and adapted housing. A university city or inner London borough may have a younger age structure and different priorities, such as rental housing and schools.
Responses to an ageing population
The UK has several possible responses:
- Raising the State Pension age so people work for longer before receiving the state pension.
- Encouraging later-life work, including flexible hours, retraining and anti-age discrimination policies.
- Improving health prevention, such as screening, exercise schemes and support for healthy lifestyles.
- Investing in social care, including care workers, home adaptations, telecare and supported living.
- Supporting families, for example through childcare help and parental leave, which may reduce barriers to having children.
- Managing migration, because working-age migrants can help fill labour shortages, especially in health, social care, agriculture, hospitality and construction.
Link response to scale
For a strong answer, separate national responses such as pension policy from local responses such as age-friendly housing, bus routes, GP access and community care services.
21st-century immigration into the UK
Migration means the movement of people from one place to another. Immigration means people moving into a country. Emigration means people leaving a country. Net migration is immigration minus emigration.
A migration flow is a movement of people from one place to another over a period of time. In the 21st century, important flows into the UK have included:
- European Union migration, especially after the 2004 EU enlargement, when many people moved from countries such as Poland and Lithuania. Later flows also included Romania and Bulgaria. Brexit changed the system, with less free movement from the EU.
- Commonwealth and global work migration, including people from India, Pakistan, Bangladesh, Nigeria and other countries, often linked to jobs, family connections, healthcare, business and education.
- International students, with many coming from countries such as China, India and Nigeria to UK universities.
- Humanitarian flows, including refugees and people arriving through schemes linked to Syria, Afghanistan, Ukraine and Hong Kong.
Many immigrants are young adults, so immigration can increase the working-age population and slightly reduce the speed of ageing. However, migrants also age over time, so migration is not a complete solution to ageing.
Impacts of immigration on the UK
Economic impacts can be positive. Immigration can fill labour shortages, increase tax revenue, support universities through tuition fees, and bring enterprise and skills. The NHS and care sector have long relied on international workers.
There can also be challenges. Rapid population growth can add pressure to housing, schools, GP services and transport, especially if local funding and planning do not keep up. In some low-paid sectors, there may be concerns about job competition or wages, although impacts vary by place and occupation.
Social impacts include greater cultural diversity, new languages, religions, food, music and community organisations. Cities such as London, Birmingham, Manchester and Leicester show this clearly. London is a major global migration gateway, with a very high proportion of residents born outside the UK.
Locally, the effects can be more concentrated. For example, parts of Lincolnshire, including Boston, experienced rapid change linked to Eastern European workers in agriculture and food processing. This brought labour supply for local businesses, but also increased demand for translation, school places, rental housing and community integration.
Linking an immigration flow to impacts
-
Identify the flow and location. For example, Eastern European workers moving to agricultural and food-processing areas such as parts of Lincolnshire after EU enlargement.
-
Link to an economic impact. Farms and factories gained workers for seasonal and shift work, helping local production and business income.
-
Link to a social impact. Schools, councils and health services may need language support and integration services, while the area may also gain cultural diversity.
-
Balance the judgement. The same flow can bring benefits and pressures, and the balance depends on the speed of change and whether services are funded properly.
Using local data and fieldwork thinking
Population change is not evenly spread. Nationally, the UK is ageing, but locally, patterns differ. Inner-city areas and university towns often have younger populations. Coastal and rural areas often have older populations. London has high international migration, while some smaller towns experience more selective flows linked to particular industries.
You can investigate this using Census 2021 data, local authority profiles or choropleth maps showing over-65s, average age or people born outside the UK. In fieldwork-style thinking, you could compare a local high street with census data: care homes, mobility aids shops, schools, nurseries, language services and places of worship can all give clues about population structure.
In the exam
-
Use change over time: compare 1900 with today, rather than just describing the present.
-
Link cause, effect and response: for ageing, explain why it happens, what problems or opportunities it creates, and what the UK can do.
-
Use scale and place: combine national UK trends with local examples such as London, Lincolnshire, coastal retirement areas or your own local area.
Check yourself
- How has the shape of the UK's population pyramid changed since 1900, and why?
- Why might the UK be described as Stage 4 with possible Stage 5 tendencies on the DTM?
- What is one economic impact and one social impact of 21st-century immigration into the UK?