Study Figure 1, which shows a population pyramid for the United Kingdom.
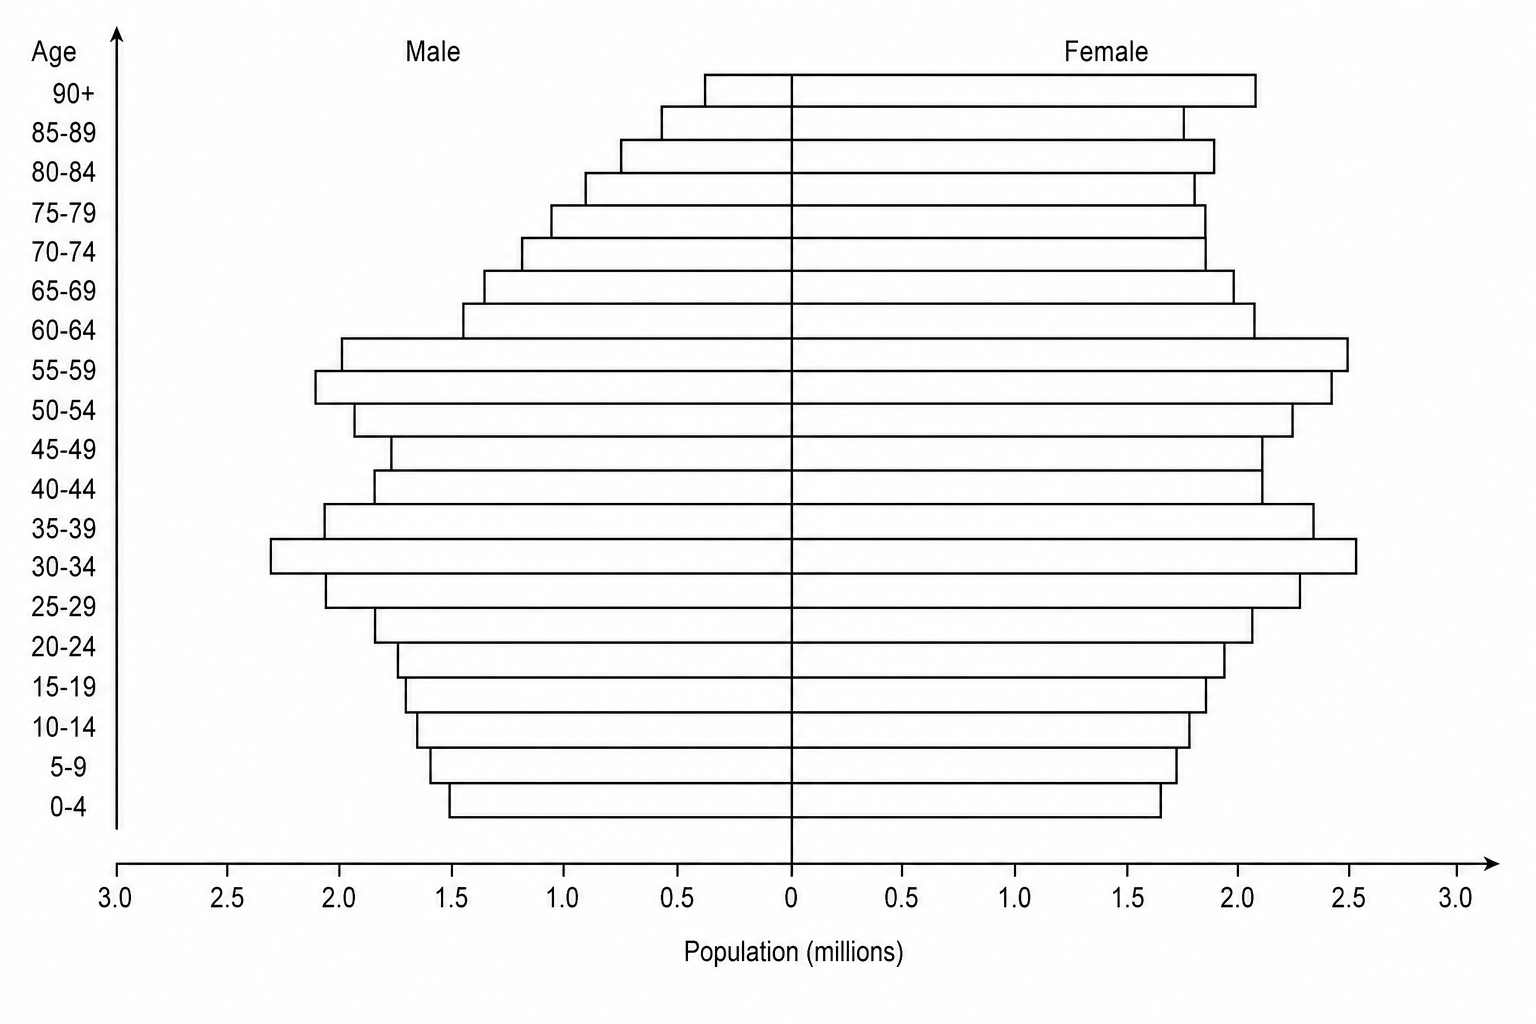
Which of the following statements correctly interprets the demographic characteristics and future implications shown in Figure 1?
The narrow base in the 0 to 90\text{ to }90 to 9 age groups indicates that the UK's total fertility rate (TFR) has risen significantly above the replacement level of 2.12.12.1.
The bulging cohorts in the 50 to 5950\text{ to }5950 to 59 age group represent a demographic dividend that will decrease the UK's old-age dependency ratio over the next two decades.
The prominent bulge in the 30 to 3930\text{ to }3930 to 39 age group is driven primarily by a high rate of net outward migration of young working-age professionals.
The substantial top of the pyramid in the 80+80+80+ cohorts, with a higher proportion of females than males, reflects high life expectancy and a gender gap in mortality.