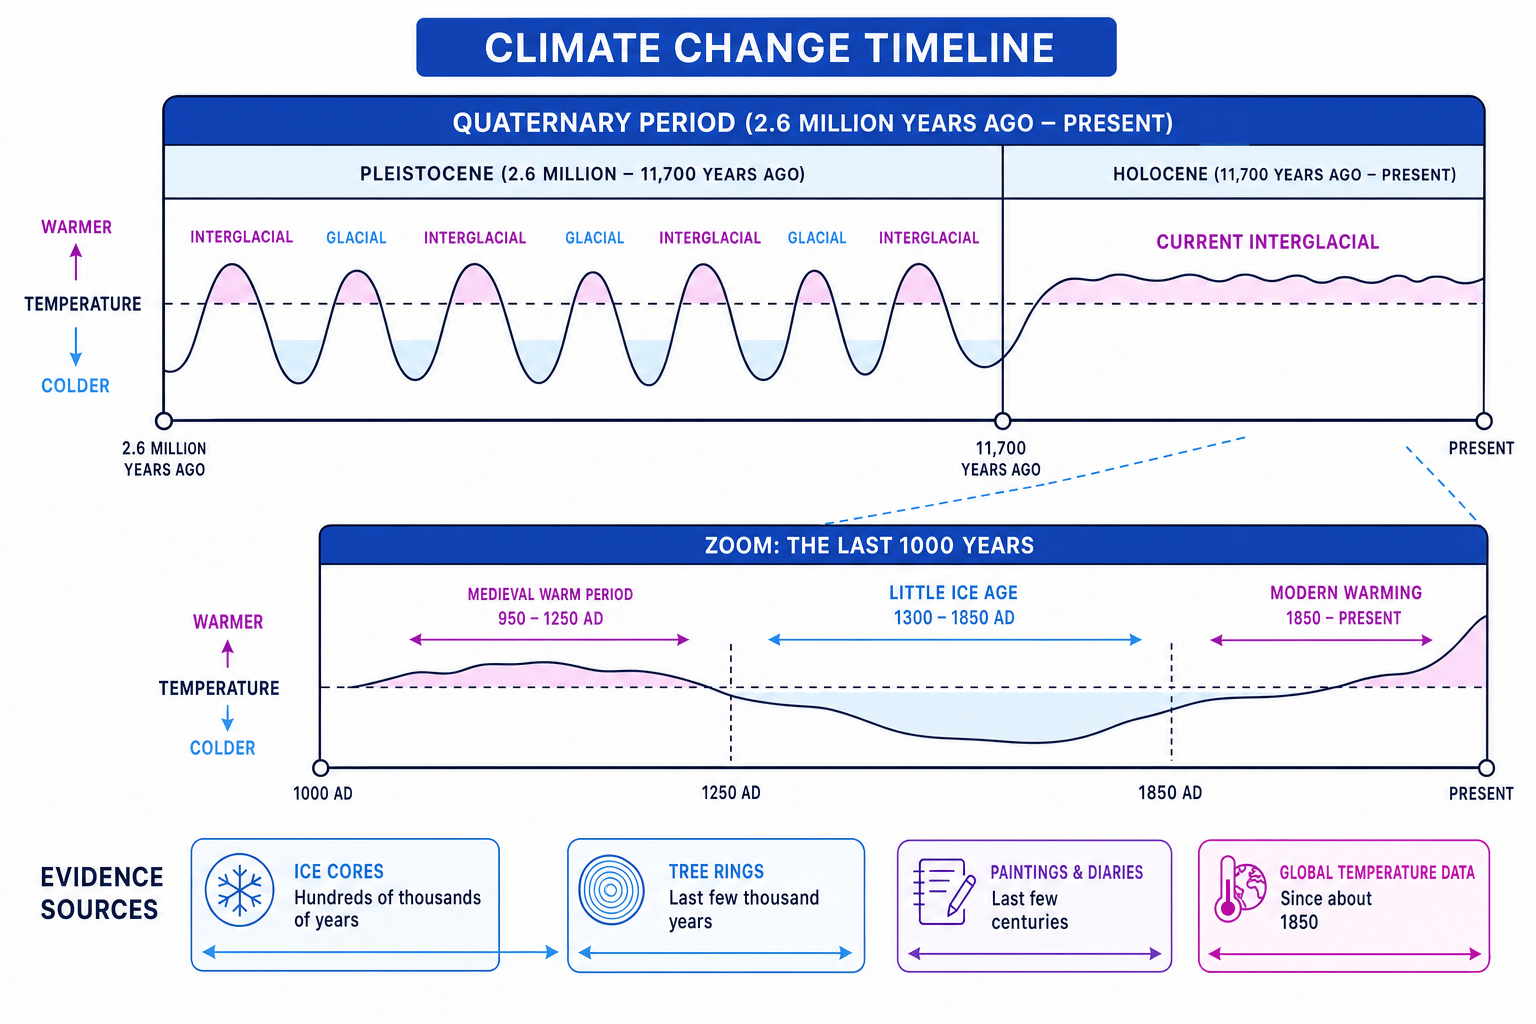
What you'll learn
- How climate has changed from the start of the Quaternary period to today.
- The difference between cold glacial periods and warmer interglacial periods.
- The key warming and cooling periods since 1000 AD.
- How evidence such as ice cores, tree rings, paintings, diaries and global temperature data helps prove climate change.
Start with the basics: weather, climate and time
Weather is what the atmosphere is doing in a place over a short time: today’s temperature, rainfall, wind and cloud. Climate is the long-term average pattern of weather, usually measured over 30 years or more.
Climate
Climate is the average pattern of weather conditions in a place over a long period of time, usually at least 30 years.
Climate change means a long-term shift in average conditions. This can include changes in temperature, rainfall, ice cover, sea level and extreme weather patterns.
The key idea for this section is that Earth’s climate has never been completely fixed. It has changed naturally over millions of years, but the recent warming is unusually fast and is measured very clearly by modern data.
The Quaternary period: the big timeline
The Quaternary period is the most recent geological period. A geological period is a named block of Earth’s history used by scientists to organise deep time.
Quaternary period
The Quaternary period began about 2.6 million years ago and continues to the present day. It includes repeated cold and warm phases of climate.
The Quaternary is split into two main parts:
- Pleistocene Epoch: from about 2.6 million years ago to 11,700 years ago.
- Holocene Epoch: from about 11,700 years ago to today.
The Pleistocene had repeated cold stages and warm stages. The Holocene is the warm interglacial period we live in now.
Glacial and interglacial periods
A glacial period is a long colder stage when ice sheets grow and spread. An interglacial period is a warmer stage between glacials when ice retreats.
During glacial periods, huge ice sheets covered parts of North America, northern Europe and Asia. In the last glacial period, ice covered much of Scotland, Wales and northern England. Sea levels were lower because so much water was stored as land ice.
Use this timeline to keep the whole topic in order.
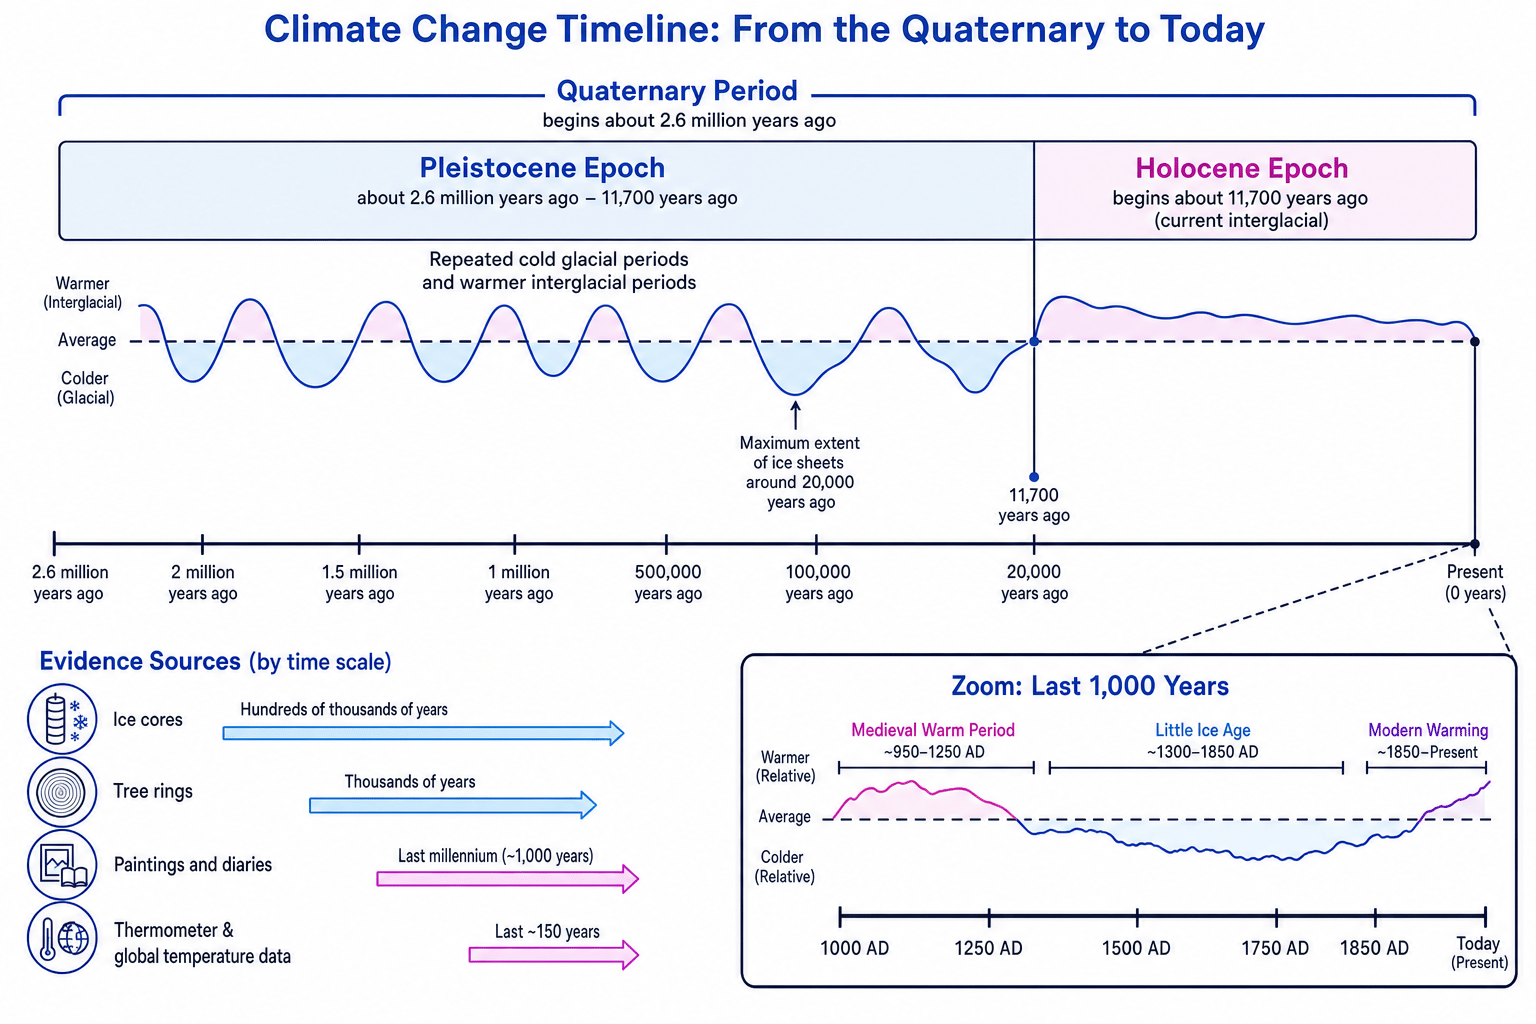
The Quaternary was not one steady climate
Since the start of the Quaternary, global climate has repeatedly shifted between colder glacial periods and warmer interglacial periods. The present day is part of the Holocene interglacial.
Ice age does not mean one single cold event
At GCSE, “ice ages” often refers to cold glacial periods within the Quaternary. Do not describe the whole Quaternary as one simple block of freezing climate.
Describing change across the Quaternary
- Start with the time scale: the Quaternary began about 2.6 million years ago, so the answer must describe long-term global change, not just the last few decades.
- Identify the pattern: climate did not move in one straight line; it fluctuated between colder glacial periods and warmer interglacial periods.
- Add a key turning point: the current Holocene interglacial began about 11,700 years ago after the last glacial period ended.
- Put it into a clear sentence: “Since the start of the Quaternary, Earth’s climate has alternated between cold glacial periods with expanding ice sheets and warmer interglacial periods, including the Holocene interglacial we live in today.”
Key climate periods since 1000 AD
The spec also wants you to know the main warming and cooling periods over the last 1,000 years. Here, the time scale is much shorter than the whole Quaternary, so we use evidence such as tree rings, written records, paintings and modern temperature data.
AD is the calendar dating system used in the specification. 1000 AD means about 1,000 years after year 1.
Medieval Warm Period
The Medieval Warm Period, sometimes called the Medieval Climate Anomaly, lasted roughly from 950 to 1250 AD. Some areas, especially around the North Atlantic and parts of Europe, experienced warmer conditions.
Evidence includes tree rings, historical documents and signs of farming or settlement changes, such as Norse settlement in Greenland. However, it was not equally warm everywhere.
Little Ice Age
The Little Ice Age was a cooler period lasting roughly from 1300 to 1850 AD. It was not a true ice age like a Quaternary glacial period, but many regions had colder winters and shorter growing seasons.
Evidence includes:
- paintings showing larger Alpine glaciers
- records of harsh winters in Europe
- Thames Frost Fairs in London, when the River Thames froze during some severe winters
- tree-ring evidence showing slower growth in colder years
Be careful with Thames Frost Fairs
The Thames freezing is useful historical evidence of colder winters, but it was also affected by old bridge design and a slower river flow. Use it as supporting evidence, not proof on its own.
Modern warming
Modern warming refers to the strong rise in global average temperature since around 1850, especially since the mid-20th century. Global temperature data shows that Earth is now about 1.1–1.3°C warmer than the late 19th century, depending on the dataset used.
This period is different from earlier changes because it is:
- measured directly by instruments across the world
- rapid compared with many earlier natural changes
- global in pattern, not just regional
Do not overstate medieval warming
Do not write that the whole world was warmer than today during the Medieval Warm Period. Evidence suggests medieval warmth was uneven and regional, whereas modern warming is clearly global.
Evidence for climate change
Scientists use different evidence depending on the time period being studied. Some evidence is direct, meaning it measures climate itself. Other evidence is proxy evidence, meaning it gives an indirect clue.
Proxy evidence
Proxy evidence is indirect evidence of past climate, such as tree rings or ice cores, used when direct thermometer records are not available.
Global temperature data
Global temperature data comes from thermometers at weather stations, ships, ocean buoys and satellites. It is the most direct evidence for recent climate change.
Reliable global records go back to around 1850. They show a clear warming trend, with the warmest years mostly occurring in the 21st century.
Scientists often use temperature anomalies rather than raw temperatures.
Temperature anomaly
A temperature anomaly is the difference between a measured temperature and a chosen long-term average, called the baseline.
Using anomalies makes it easier to compare places with very different climates. For example, Antarctica and the Sahara have very different actual temperatures, but both can be compared by asking how much warmer or colder they are than normal for that place.
Calculating a temperature anomaly
- Use the rule:
- Substitute the data: if the measured global average is 15.2°C and the baseline average is 14.0°C, then:
- Interpret the result: the anomaly is +1.2°C, meaning the measured temperature is 1.2°C warmer than the baseline average.
How to describe a temperature graph
Use three parts: the overall trend, any fluctuations, and a piece of evidence. For example: “The graph shows an overall warming trend, especially after 1950, although there are year-to-year fluctuations.”
Ice cores
An ice core is a long cylinder of ice drilled from an ice sheet, such as those in Antarctica or Greenland. Snow falls, becomes compressed into ice, and traps tiny air bubbles.
Ice cores can show climate conditions hundreds of thousands of years into the past. Antarctic ice cores, such as the Vostok and EPICA cores, provide evidence for repeated glacial and interglacial cycles.
They are useful because they contain:
- trapped gases, such as carbon dioxide and methane
- oxygen isotopes, which help estimate past temperature
- dust and volcanic ash, which can show drier, windier or volcanic periods
- annual layers in some sections, rather like pages in a book
Tree rings
Tree-ring study is called dendrochronology. Many trees grow one ring each year. Wider rings often suggest better growing conditions, while narrower rings may suggest colder or drier conditions.
Tree rings are useful for reconstructing climate over hundreds or thousands of years. They are especially helpful in places where tree growth is strongly limited by temperature or rainfall.
However, tree rings need careful interpretation because growth can also be affected by disease, fire, soil conditions and the age of the tree.
Paintings and diaries
Paintings, diaries and written records are forms of historical evidence. They are useful for the last few centuries, especially before widespread thermometer records.
Examples include:
- paintings showing Alpine glaciers extending further down valleys during the Little Ice Age
- diaries describing severe winters, late harvests or frozen rivers
- records of harvest dates, which can suggest warmer or cooler growing seasons
This evidence is valuable because it gives human observations from the time. However, it is often local, incomplete and sometimes subjective.
The strongest evidence is cross-checked
Scientists are most confident when different evidence sources point to the same conclusion. For example, tree rings, glacier paintings and written records all support cooler conditions during parts of the Little Ice Age.
Selecting evidence for a time period
- Identify the time period: if you are investigating climate 400,000 years ago, the evidence must reach far beyond written records and modern instruments.
- Match the evidence to the time scale: ice cores are suitable because Antarctic ice cores can preserve climate evidence over hundreds of thousands of years.
- Reject weaker options: diaries and paintings only cover recent centuries, global temperature data mainly covers the period since about 1850, and tree rings usually cover thousands rather than hundreds of thousands of years.
- Justify the choice: ice cores are best because trapped gases and isotope evidence can be used to reconstruct ancient temperatures and atmospheric conditions.
Bringing it together
For this section, think in layers of time:
- Millions of years: the Quaternary period shows repeated glacial and interglacial cycles.
- Thousands of years: the Holocene is the current warm interglacial.
- Last 1,000 years: medieval warming, the Little Ice Age and modern warming show shorter-term changes.
- Last 150 years: direct global temperature data shows rapid modern warming.
The exam may ask you to describe climate change, compare periods, or explain how evidence shows climate has changed. Strong answers use dates, named evidence and careful wording.
In the exam
- Use chronological order: Quaternary from about 2.6 million years ago, Holocene from about 11,700 years ago, then medieval warming, Little Ice Age and modern warming.
- Match evidence to time scale: ice cores for hundreds of thousands of years, tree rings for thousands of years, paintings and diaries for recent centuries, and global temperature data since about 1850.
- Avoid overclaiming: write “regional” where evidence is uneven, and reserve “global” for patterns supported by worldwide data such as modern temperature records.
Check yourself
- What is the difference between a glacial period and an interglacial period?
- Which evidence source would be best for investigating climate 400,000 years ago, and why?
- How do the Medieval Warm Period, Little Ice Age and modern warming differ in timing and evidence?