

Urbanisation is one of the most defining global processes of the 21st century. However, this process is not happening at the same speed or in the same way everywhere. In this topic, we will explore how urban areas grow, why some regions are urbanising faster than others, and how these global patterns compare to the specific urban layout of the UK.
What you'll learn
- The contrasting trends and rates of urbanisation in developed, emerging, and developing countries over the last 50 years.
- The physical and human factors driving global urbanisation, alongside its main environmental and socio-economic effects.
- The uneven distribution of the UK's urban population and the reasons why different UK regions are growing at different speeds.
Global Urbanisation: Different Paths, Different Speeds
Before looking at the trends, we need to understand exactly what we are measuring.
Urbanisation
Urbanisation is the rise in the proportion of a country's population living in urban areas (towns and cities) compared to rural areas (the countryside). It is usually expressed as a percentage.
It is vital to distinguish between urbanisation (a percentage change) and urban growth (the physical expansion of a city's footprint or the absolute increase in the number of people living there).
Over the past 50 years, the world has shifted from being predominantly rural to predominantly urban. In 1970, just over 36%36\%36% of the global population lived in cities; by 2020, that figure exceeded 56%56\%56%, and it is projected to reach nearly 70%70\%70% by 2050.
However, this global average hides massive differences between developed, emerging, and developing nations.
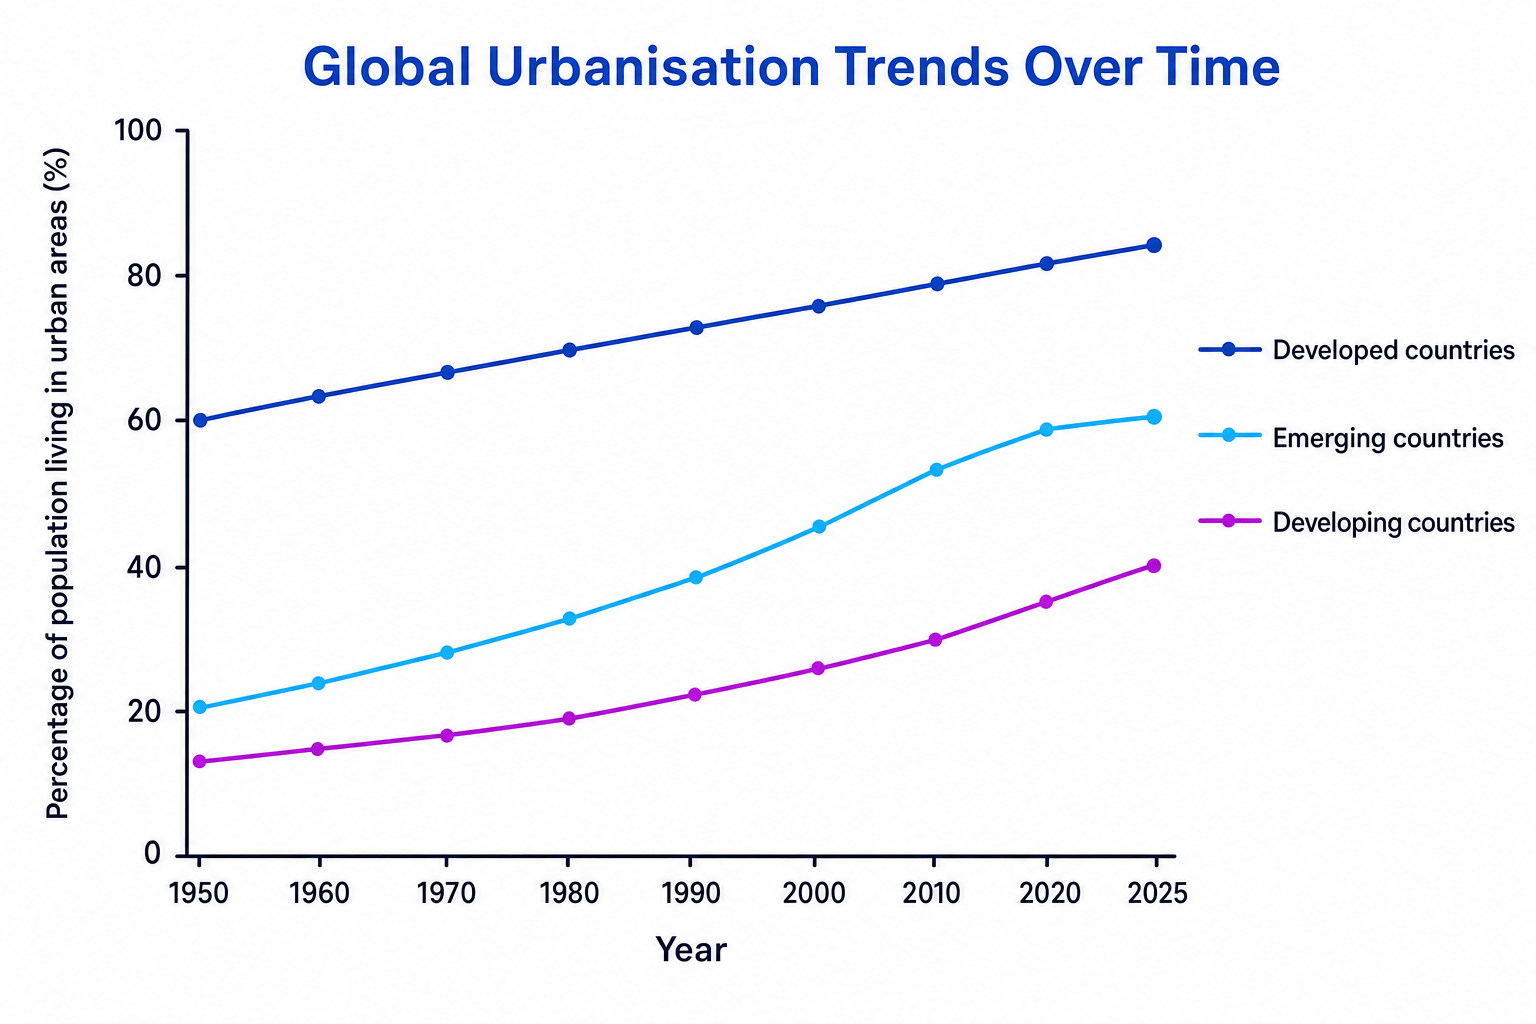
1. Developed Countries (HICs)
- The Pattern: High level of urbanisation (typically 75%75\%75% to 85%85\%85%), but a very slow or stagnant rate of growth.
- The Reason: These countries (such as the UK, Japan, and the USA) underwent their primary urbanisation phase during the Industrial Revolution in the 18th and 19th centuries. Today, most people already live in cities.
- Current Trend: Many developed cities are experiencing suburbanisation (movement to the suburbs) or counter-urbanisation (people moving away from cities to rural areas, facilitated by high-speed internet and transport links).
2. Emerging Countries (NEEs)
- The Pattern: Rapid, steep increases in both the rate and percentage of urbanisation over the last 50 years.
- The Reason: Countries like China, India, and Brazil have experienced massive economic development, industrialisation, and investment.
- The Scale: In 1978, only about 18%18\%18% of China's population lived in cities. Following rapid economic reforms, that figure is now over 60%60\%60%, representing hundreds of millions of people moving to urban centers in just a few decades.
3. Developing Countries (LICs)
- The Pattern: Low overall level of urbanisation (often under 40%40\%40%), but the fastest rate of urban growth in the world.
- The Reason: Countries like Ethiopia, Nepal, and Malawi are still largely agrarian (farming-based) societies. However, extreme push factors from rural areas and high rates of natural increase are causing cities to swell rapidly.
The Urbanisation Divide
Developed countries have high levels of urbanisation but slow rates of growth. Developing countries have low levels of urbanisation but rapidly accelerating rates of growth.
Why Urbanisation Occurs: The Drivers
Urbanisation is driven by two main mechanisms: rural-to-urban migration and natural increase.
Rural-to-Urban Migration
This is the movement of people from the countryside to cities. It is driven by a combination of "push" factors (things that force people to leave the countryside) and "pull" factors (things that attract people to the city).
- Push Factors:
- Low crop yields due to climate change, drought, or soil erosion.
- Agricultural mechanisation (machinery replacing manual jobs).
- Extreme poverty and lack of basic services (schools, clinics).
- Pull Factors:
- The perception of well-paid employment and job opportunities in factories or services.
- Better access to healthcare and secondary/tertiary education.
- A wider range of entertainment and "bright lights" of the city.
Natural Increase
Once migrants arrive in cities, they are typically young adults (aged 18–35) looking for work. This age demographic means they are likely to have children.
As a result, birth rates in cities rise rapidly while death rates fall due to better access to medical care. This gap between birth and death rates is called natural increase, and it accounts for over half of the urban population growth in many developing and emerging cities.
Confusing Rate and Level
In exams, do not confuse the level of urbanisation with the rate of urbanisation.
- Level = the current proportion of the population in cities (e.g. "UK's level is 84%84\%84%").
- Rate = the speed at which that percentage is growing (e.g. "The UK's rate is less than 1%1\%1% per year, whereas Nigeria's rate is over 4%4\%4% per year").
Calculations in Urban Geography: Rate of Change
In the GCSE exam, you may be asked to interpret demographic data and calculate the percentage rate of change for a population over a given period. Let’s walk through how to do this.
Calculating Percentage Change in Urban Population
In 1990, the urban population of an emerging city was 4.5 million4.5\text{ million}4.5 million. By 2020, due to rapid rural-to-urban migration and natural increase, the population grew to 8.1 million8.1\text{ million}8.1 million.
Calculate the percentage increase in the city's population over this 30-year period.
- Find the absolute change in population: Subtract the original value from the new value:
- Divide the change by the original value: This shows the change as a fraction of where the city started:
- Convert to a percentage: Multiply your decimal answer by 100100100:
The city's urban population increased by 80%80\%80% between 1990 and 2020.
Urban Patterns and Rates in the UK
The UK is an entirely different story. Our urban landscape is highly developed, but it is also highly uneven.
The UK's Population Distribution
If you look at a map of the UK's population density, you will see a clear core-periphery pattern. Most of the UK’s population is concentrated in flat, low-lying urban cores, while highland rural areas are sparsely populated.
- The Core (High Density): The major concentration of urban areas stretches in a belt from the South East (focused on London), up through the Midlands (Birmingham), to the North West (Manchester and Liverpool) and Yorkshire (Leeds and Sheffield). There is also a distinct urban core in the Central Belt of Scotland (Glasgow and Edinburgh).
- The Periphery (Low Density): Areas like northern Scotland (the Highlands), central Wales, and parts of the South West (Cornwall) have very low population densities.
Core-Periphery Model
A model that describes how economic power and population are concentrated in a dominant central area (the core), leaving outlying areas (the periphery) less developed and more sparsely populated.
Factors Affecting UK Regional Variation
Why is the UK's urban population distributed this way? The differences in rate and degree of urbanisation across regions are caused by a mix of physical and human factors:
| Factor Type | How it Influences UK Urbanisation |
|---|---|
| Physical Factors | Flat, low-lying land in the South and East makes building homes and transport networks (railways, motorways) easy. Extreme mountainous relief in northern Scotland and Wales restricts urban growth. A milder climate in the South also historically favoured agriculture and settlement. |
| Historical Factors | During the Industrial Revolution, cities grew rapidly near coalfields and iron ore reserves (e.g., Sheffield, Newcastle, Glasgow, Cardiff) and near major deep-water ports (e.g., Liverpool, Bristol). |
| Economic Factors | Since the mid-20th century, the UK has undergone deindustrialisation (the decline of manufacturing). Northern industrial cities lost jobs and experienced slow or negative growth. Meanwhile, the South East transformed into a post-industrial finance and technology hub, attracting young professionals and driving rapid urban growth in London and its commuter towns. |
Look for the physical-human link
When explaining UK distribution, always link physical Geography to human choice. For example: Flat relief (physical) makes it cheaper to construct highways and offices (human), which attracts multinational businesses (economic), resulting in urban growth.
In the exam
- Command words matter: If a question asks you to "Describe the distribution...", do not explain why it is there. Just say where it is. Use compass points (North, South-East), name specific cities or regions, and identify patterns (e.g. "concentrated", "linear", or "dispersed").
- Use data to support your points: If a graph or table is provided, quote specific numbers. For instance, do not just write "the urban percentage increased." Write: "the urban percentage increased from 22%22\%22% in 1980 to 58%58\%58% in 2020."
- Contrast HICs and LICs/NEEs clearly: Use comparative language like "whereas", "on the other hand", or "in contrast" to show examiners that you understand the diverging trends.
Check yourself
- Why do emerging countries (NEEs) currently show the steepest increase on global urbanisation curves?
- Explain the difference between natural increase and rural-to-urban migration.
- Why did the location of coalfields play such a massive role in shaping the historical urban pattern of the UK?
