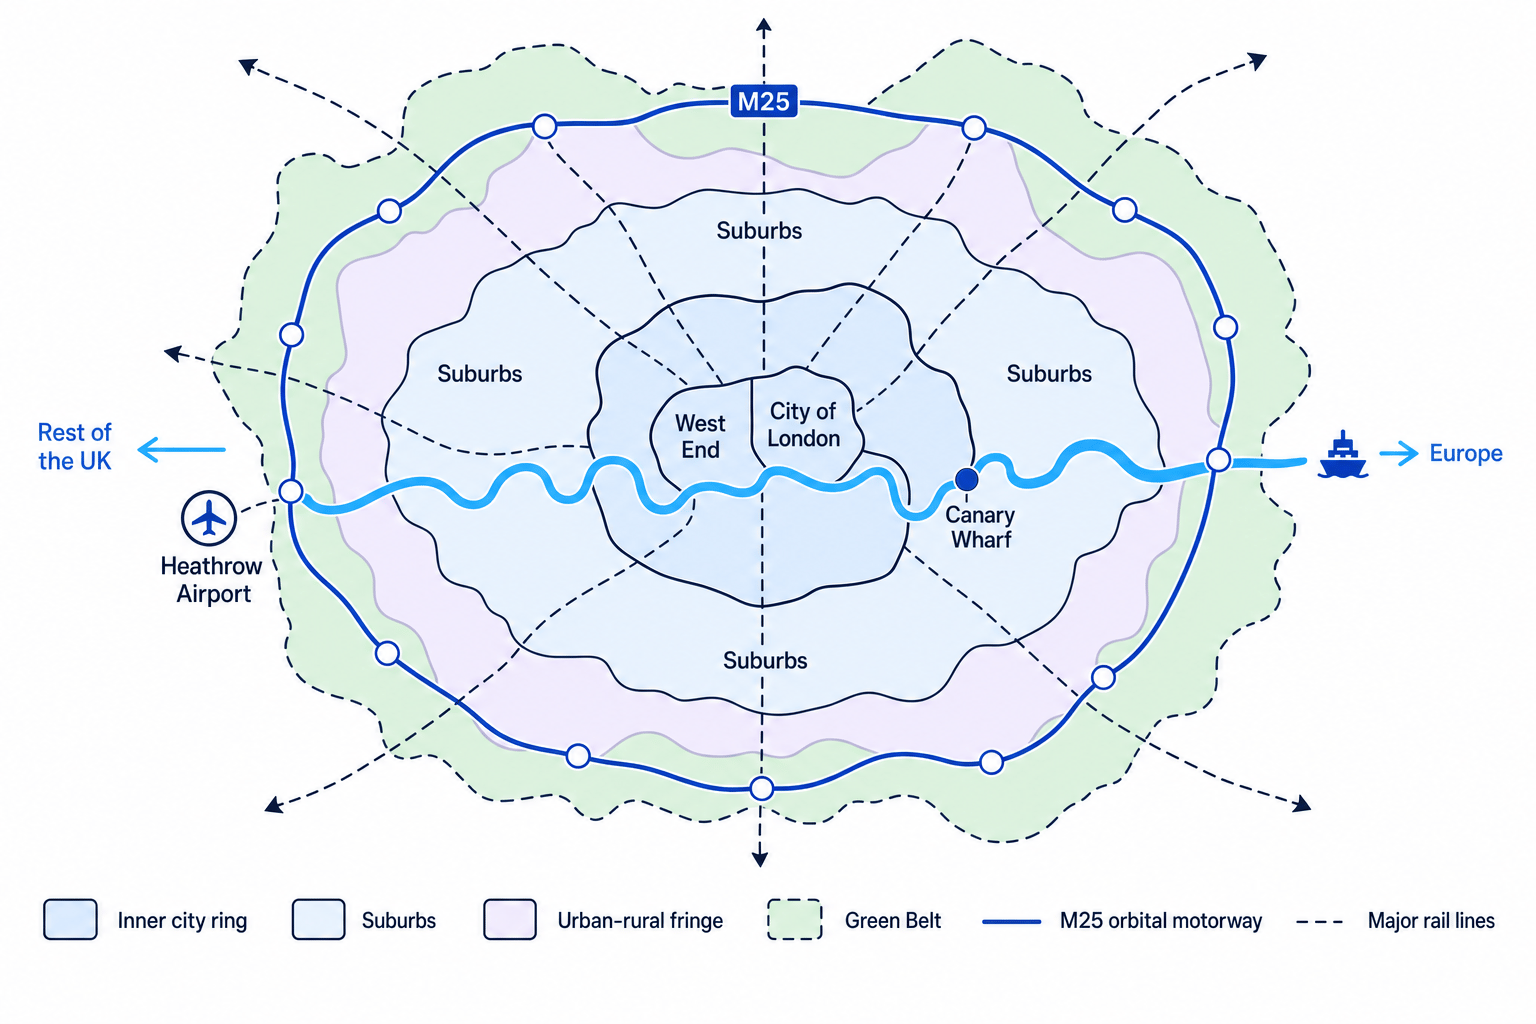
What you'll learn
- How London’s location and connections shape what it does.
- How its CBD, inner city, suburbs and urban-rural fringe differ.
- How migration, deindustrialisation and retail change have reshaped the city.
- How London is trying to become more sustainable and improve quality of life.
These notes use London as the chosen major UK city. If your school uses a different city, keep the same headings but swap in your own named places and evidence.
London as a major UK city
London is the UK’s capital city and the largest city in the UK. For this case study, use Greater London, which had about 8.8 million people in the 2021 Census. Do not confuse this with the City of London, which is only the small historic financial district.
Greater London is not the City of London
The City of London is one part of the CBD. Your case study is usually Greater London, including inner and outer boroughs such as Newham, Croydon, Brent, Bromley and Westminster.
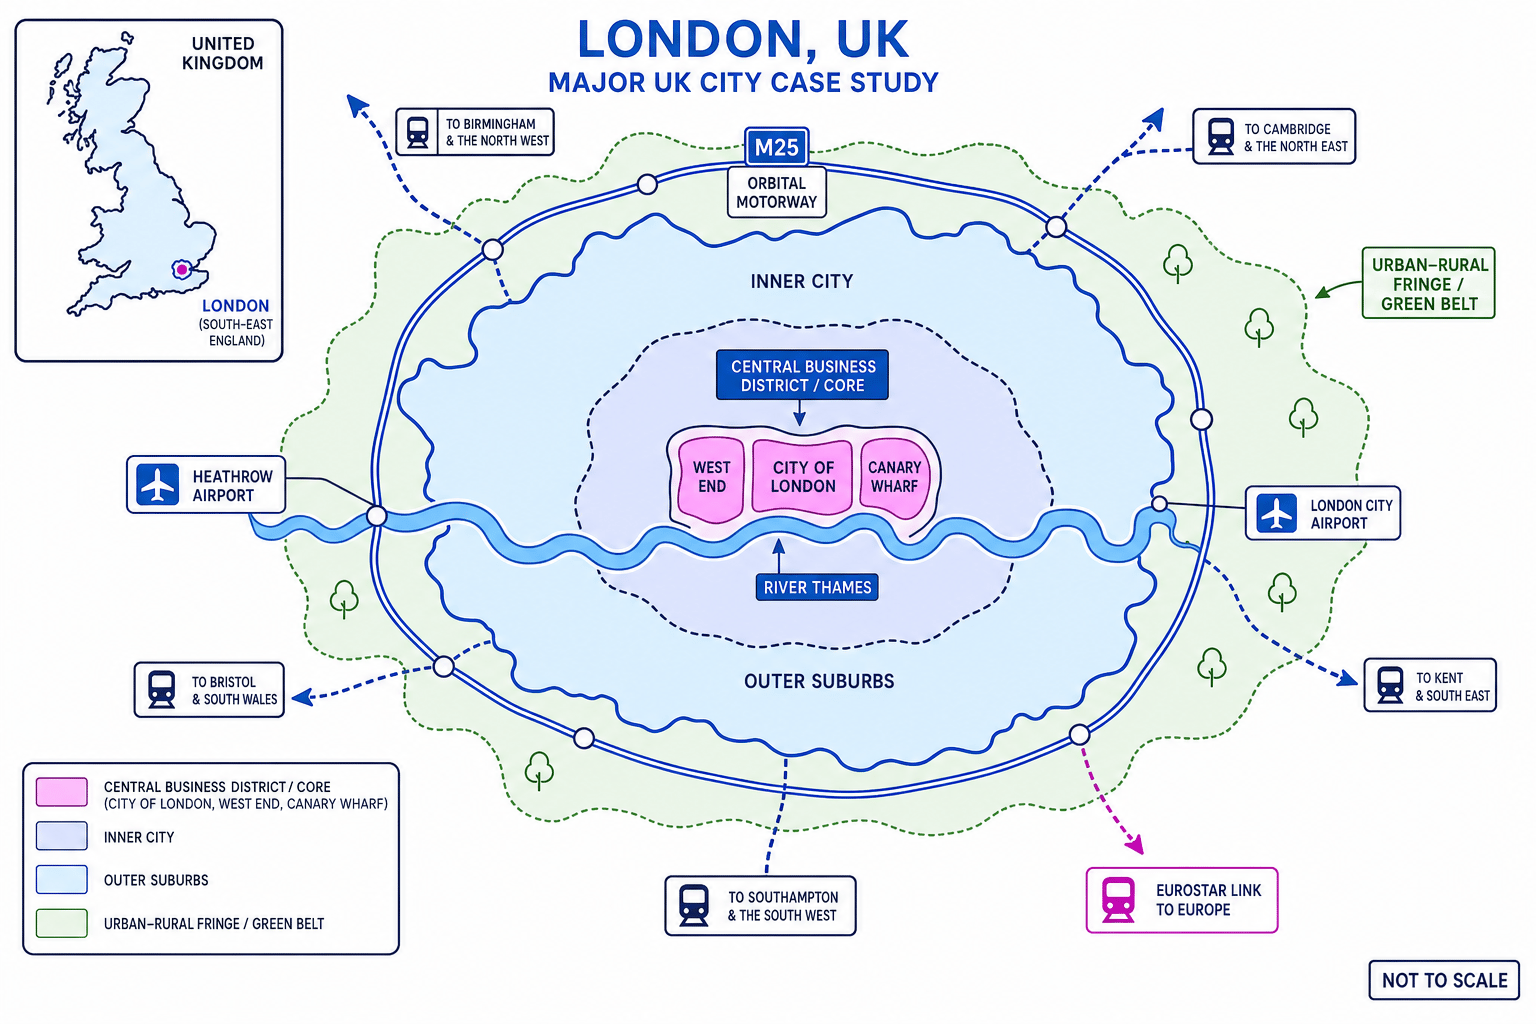
The map below shows London’s national position, its main urban zones and key transport links. Use it as a schematic: it is useful for relationships, not exact distances.
1. Context: site, situation and connectivity
Site, situation and connectivity
- Site means the physical characteristics of the place where a settlement grew, such as relief, rivers and flood risk.
- Situation means where a place is compared with other places.
- Connectivity means how well a place is linked by transport, communication and flows of people, goods and money.
London’s site is on the River Thames in a lowland basin. The river helped trade and transport, but also creates flood risk, managed partly by the Thames Barrier.
London’s situation is in south-east England, close to Europe and within the UK’s most densely populated and economically powerful region. Nationally, it is the centre of government, culture, media, finance and tourism. Environmentally, its growth is shaped by the Thames, air pollution, flood risk and the surrounding Green Belt.
London’s connectivity is extremely strong. It has major airports such as Heathrow, rail links to the rest of the UK, the Underground, the Elizabeth line, the M25 and Eurostar links to Europe. Globally, it is a major financial, cultural and migration hub.
Linking London’s location to its functions
- Start with the site: the River Thames helped London grow as a trading port, so early functions included docks, warehouses and markets.
- Add the situation: being in south-east England and close to Europe helped London become the UK’s political and commercial centre.
- Add connectivity: airports, rail and digital links support global finance, tourism, universities and headquarters today.
2. London’s urban structure
Urban structure
Urban structure means the pattern of land uses within a city. A function is the main role of an area, such as shopping, finance, housing, industry or leisure.
London is not arranged in perfect rings, but the main zones are clear.
Central Business District and core
The Central Business District (CBD) is the most accessible part of a city, with high land values and many shops, offices and services. In London, the core includes the City of London for finance, the West End for shopping, theatres and tourism, and Canary Wharf as a newer financial district. Buildings range from historic landmarks to modern high-rise offices.
Inner city
The inner city surrounds the CBD. Areas such as parts of Tower Hamlets, Southwark, Hackney and Newham include Victorian terraces, former industrial land, council estates and newer apartments. Functions are mixed: housing, creative industries, universities, transport hubs and regenerated dockland.
Suburbs
Suburbs are mainly residential areas further from the centre, often with inter-war or post-war semi-detached housing, schools, parks and local shopping centres. Examples include parts of Bromley, Harrow, Enfield and Croydon. Many residents commute to central London.
Urban-rural fringe
The urban-rural fringe is the edge of the built-up city, where urban land meets countryside. Around London it includes Green Belt land, reservoirs, airports, business parks, logistics sites and housing pressure.
Structure takeaway
London’s structure reflects accessibility, land value, building age and planning. The centre has high-value services; the inner city shows older industry and regeneration; suburbs are mainly residential; the fringe faces pressure for development.
3. Urban change: the sequence of processes
Urban change processes
- Urbanisation is the growth of towns and cities, often linked to rural-to-urban migration and industrial jobs.
- Suburbanisation is movement from the inner city to the suburbs.
- Counter-urbanisation is movement from cities to smaller towns or rural areas beyond the urban edge.
- Re-urbanisation is movement of people and investment back into inner-city areas after decline or regeneration.
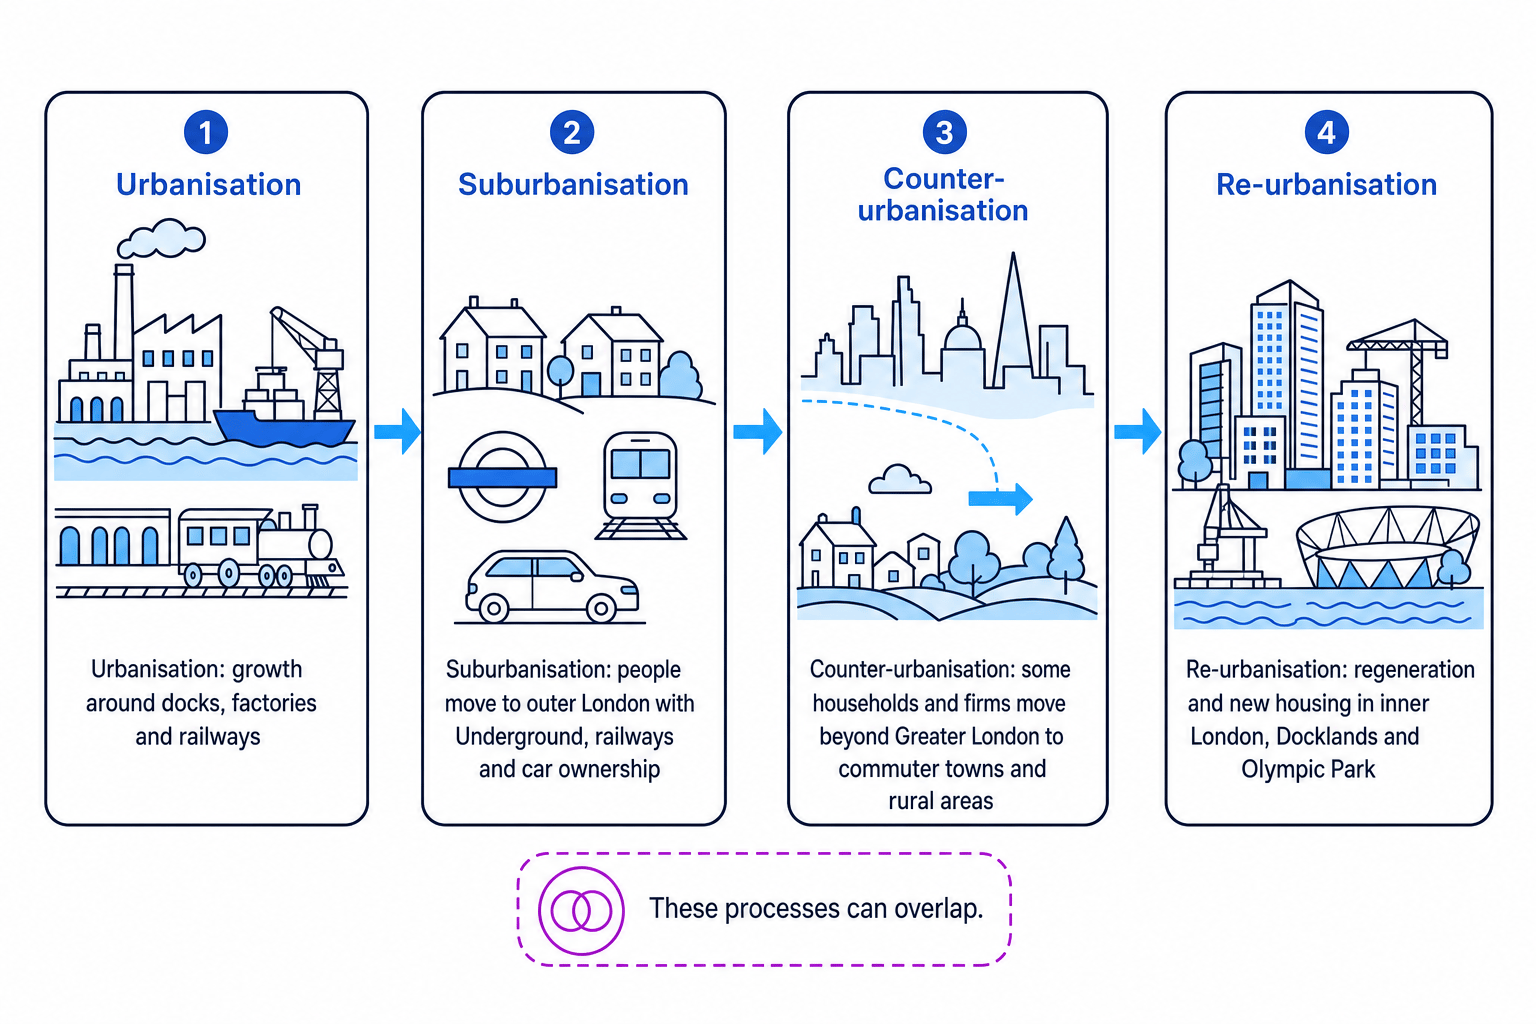
London grew rapidly during the Industrial Revolution through docks, factories and railways. Later, better railways, the Underground and car ownership encouraged suburbanisation. Some households and firms then moved beyond Greater London into commuter counties such as Kent, Surrey, Essex and Hertfordshire. More recently, re-urbanisation has occurred through regeneration in places such as Docklands, King’s Cross and the Olympic Park.
Separating suburbanisation and counter-urbanisation
- Check the destination. If people move from inner London to outer London, such as from Islington to Barnet, that is suburbanisation.
- If they move beyond Greater London to a smaller town or rural area, such as parts of Hertfordshire or Kent, that is counter-urbanisation.
- Link the reason to the process: cheaper housing, more space and remote working often support counter-urbanisation.
Re-urbanisation is not just urbanisation again
Urbanisation is the original growth of the city. Re-urbanisation is renewed growth or investment in inner areas after decline, often through regeneration and new housing.
4. Migration and Census population characteristics
Census
The Census is an official population count, usually every 10 years. It records data such as age, ethnicity, housing, employment, households and population size.
London’s Census profile shows a large, diverse and relatively young population. It has many people aged 20–39 because of universities, jobs, culture and international links. Ethnic diversity is high, but it varies by borough: areas such as Newham, Brent, Tower Hamlets and Hounslow are especially diverse.
London grows or declines unevenly. Growth can come from natural increase when births exceed deaths, international migration, young adults moving from other UK regions, and new housing in regenerated areas. Some areas may grow more slowly or lose families because of high housing costs, overcrowding, remote working or people moving to commuter towns.
Migration affects different parts of the city:
- Inner London often has high rental demand, younger adults, students and international communities.
- Suburbs may see demand for family housing, schools, GPs, religious buildings and community services.
- The CBD has a small resident population in some areas but huge daytime flows of commuters and tourists.
Calculating population percentage change
Suppose Greater London grew from about 8.2 million in 2011 to about 8.8 million in 2021.
- Find the change: 8.8 million minus 8.2 million = 0.6 million.
- Use the percentage change formula:
- Substitute the values:
- So you could say London grew by about 7%, depending on the exact boundary and dataset used.
5. Economic change, inequality and retailing
Deindustrialisation
Deindustrialisation is the decline of manufacturing and industrial employment in an area.
London deindustrialised because of globalisation, where production shifted to cheaper locations worldwide; decentralisation, where firms moved to cheaper edge-of-city sites; technological advances, such as automation and containerisation; and improved transport, which meant factories no longer had to be close to central docks.
The impacts were strongest in parts of East London and Docklands. Old docks and factories closed, jobs were lost, land became derelict and deprivation increased. Later regeneration created new offices and housing, especially at Canary Wharf, but not everyone had the skills or income to benefit.
Quality of life
Quality of life means people’s overall wellbeing, including income, housing, health, safety, education, environment and access to services.
Economic change has increased inequality. London has high-paid finance, technology and creative jobs, but also low-paid service work and very high housing costs. Quality of life can differ sharply between wealthy areas such as parts of Richmond or Kensington and more deprived neighbourhoods in inner or east London.
Retailing has also changed. Some traditional CBD shopping areas face pressure from high rents, reduced footfall and online shopping, although the West End remains nationally important. Edge-of-town and out-of-town shopping offer parking and large stores, for example Westfield Stratford and retail parks. Internet shopping increases delivery traffic and demand for warehouses, while high streets shift towards food, leisure and experiences.
Balance retail answers
Do not write that London’s CBD has “died”. A better answer is that some retail functions have declined or changed, while tourism, leisure, offices and flagship shopping remain important.
6. Strategies for sustainability and better quality of life
Sustainable urban living
Sustainable urban living means meeting people’s needs now while reducing environmental damage and protecting future generations.
London uses a range of strategies:
- Recycling: borough recycling schemes, food waste collection and reuse projects reduce landfill, though flats can be harder to serve.
- Employment: regeneration in Docklands, Stratford and King’s Cross creates jobs, but training is needed so local people can access them.
- Education: new schools, college links, apprenticeships and support for pupils with English as an additional language help a diverse population.
- Health: parks, active travel, air-quality policies and improved local services aim to reduce health inequalities.
- Transport: the Underground, buses, Elizabeth line, cycling routes, Congestion Charge and ULEZ reduce car dependence and pollution.
- Affordable and energy-efficient housing: affordable housing targets, retrofitting, heat networks and schemes such as BedZED in Sutton aim to cut bills and emissions.
Evaluating the ULEZ as a sustainability strategy
- Identify the problem: traffic emissions worsen air quality, especially near busy roads, affecting health and quality of life.
- Explain the strategy: the ULEZ charges more polluting vehicles, encouraging cleaner vehicles or public transport.
- Consider the trade-off: air quality may improve, but costs can affect lower-income drivers and small businesses.
- Make a judgement: it is more sustainable when combined with affordable public transport, cycling routes and support to replace older vehicles.
Best sustainability answers
Strong answers link a strategy to environmental benefits, social benefits and economic limits. For example, transport improvements can reduce pollution, improve access to jobs and still raise questions about cost.
In the exam
- Name the place and scale clearly: use Greater London, then zoom into named areas such as Docklands, Stratford, the West End or outer suburbs.
- Build chains of explanation: cause, specific change, named part of London, then impact on people or quality of life.
- For evaluation questions, give both benefits and limits, then make a clear judgement about which strategy or impact matters most.
Check yourself
- Can you explain the difference between site, situation and connectivity for London?
- Can you describe one feature of each zone: CBD, inner city, suburbs and urban-rural fringe?
- Can you link deindustrialisation, migration or retail change to inequality in a named part of London?