

What you'll learn
- How to turn a river or coastal fieldwork task into a focused enquiry question.
- The key primary data methods for either river discharge or beach morphology and sediment.
- How qualitative evidence records river or coastal landforms.
- How secondary data, such as flood-risk or geology maps, supports your investigation.
1. What is a physical fieldwork investigation?
In GCSE Geography, fieldwork means collecting evidence outside the classroom and outside the school or college grounds. For this part of the course, you study one physical environment: either a river landscape or a coastal landscape.
The exam will treat fieldwork in a UK context, even though fieldwork does not technically have to take place in the UK. Typical UK examples include a small river such as the River Tillingbourne in Surrey, or a coast such as Swanage Bay in Dorset.
Fieldwork
Fieldwork is the collection of geographical information directly from a real place, usually to answer a specific enquiry question.
The big aim
Your physical fieldwork is not just “going to a river” or “visiting a beach”. You are collecting evidence to answer a clear question about how physical processes shape a landscape, and how those processes affect people.
2. The enquiry process: from question to evidence
Enquiry questions
An enquiry question is the main question your investigation tries to answer. A strong enquiry question is:
- linked to a real place
- measurable using fieldwork
- focused on change, pattern or relationship
- connected to geographical processes
Enquiry question
An enquiry question is a focused geographical question that can be investigated using evidence collected from a real location.
For a river investigation, the task is usually about change in a river channel. For a coastal investigation, the task is usually about coastal processes shown through landscape evidence.
Examples of better enquiry questions
A weak question might be: “What is the river like?”
That is too vague. It does not say what will be measured or what change is being investigated.
A stronger river question could be: “How does river discharge change downstream along the River Tillingbourne, Surrey?”
A stronger coastal question could be: “How does beach morphology and sediment size vary along Swanage Bay, Dorset?”
Improving an enquiry question
-
Start with the task. If the task is river channel change, choose something measurable in the channel, such as width, depth, velocity or discharge.
-
Add a spatial pattern. “Change downstream” is stronger than “what is it like?” because it lets you compare sites from upper course to lower course.
-
Add the named place. “How does river discharge change downstream along the River Tillingbourne, Surrey?” is focused because it includes a variable, a pattern and a real location.
Too vague
Avoid enquiry questions that only describe a place, such as “What features are found at the coast?” A good fieldwork question should lead naturally to data collection and analysis.
3. Types of data you need
Primary and secondary data
Primary data
Primary data is information you collect yourself during fieldwork, such as river depth readings or beach sediment measurements.
Secondary data
Secondary data is information collected by someone else, such as an Environment Agency flood-risk map, a BGS geology map, an OS map, weather records or photographs from earlier years.
Quantitative and qualitative data
Quantitative data
Quantitative data is numerical data, such as river velocity in m/s, river width in metres, beach slope angle in degrees or pebble size in mm.
Qualitative data
Qualitative data is descriptive data, such as field sketches, annotated photographs, landform descriptions or notes about evidence of erosion and deposition.
You need both. Quantitative data helps you measure patterns. Qualitative data helps you recognise landforms and explain the processes that created them.
4. If your chosen environment is rivers
River task: investigating change in a river channel
A river investigation normally studies how the channel changes from one site to another. For example, you might compare three sites from upstream to downstream.
Key river terms
River discharge
River discharge is the volume of water flowing past a point in a river each second. It is usually measured in cubic metres per second.
Catchment area
A catchment area is the area of land drained by a river and its tributaries. Rainfall in the catchment may eventually flow into the river system.
Quantitative method: measuring discharge
To calculate discharge, you need two things:
- cross-sectional area of the river channel
- mean velocity of the water
The basic formula is:
Q=A×vˉQ = A \times \bar{v}Q=A×vˉwhere QQQ is discharge, AAA is cross-sectional area, and vˉ\bar{v}vˉ is mean velocity.
At a fieldwork site, you might:
- Stretch a tape measure across the river to measure width.
- Measure depth at regular intervals using a metre ruler.
- Use a flow meter, or a float over a measured distance, to estimate velocity.
- Calculate cross-sectional area and multiply by mean velocity.
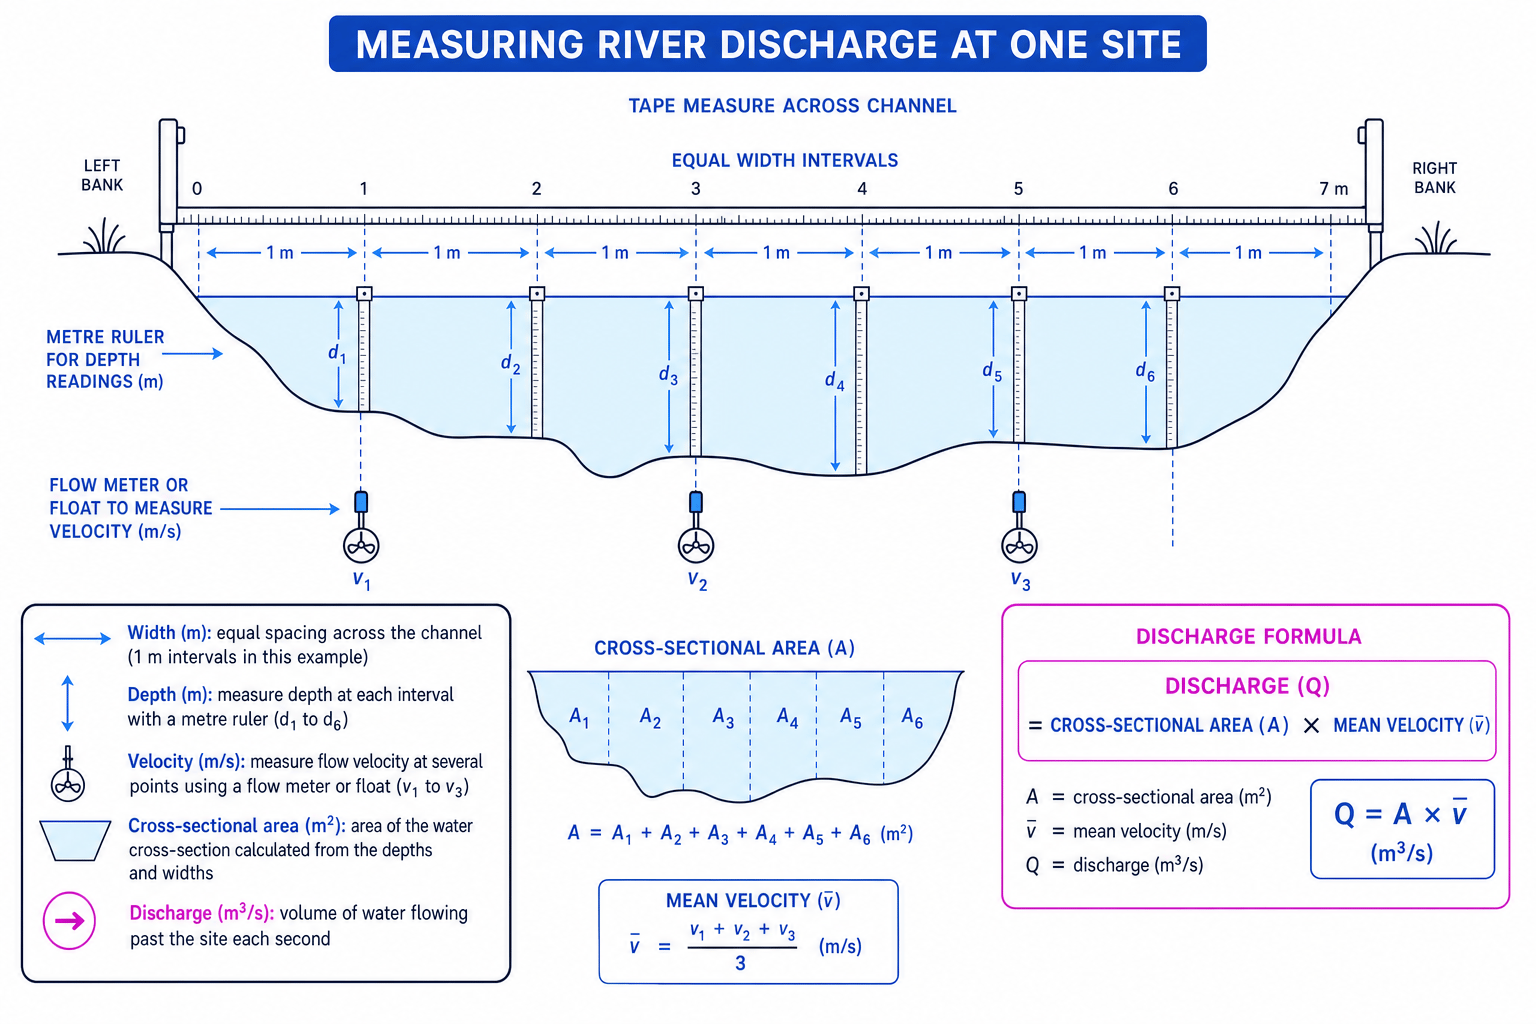
Calculating river discharge
-
Calculate cross-sectional area. If the river is divided into 1 m intervals and the depth readings are 0.2 m, 0.4 m, 0.5 m, 0.3 m and 0.1 m, the approximate area is:
A=1×(0.2+0.4+0.5+0.3+0.1)=1.5A = 1 \times (0.2 + 0.4 + 0.5 + 0.3 + 0.1) = 1.5A=1×(0.2+0.4+0.5+0.3+0.1)=1.5So the cross-sectional area is 1.5 m².
-
Use the mean velocity. If the measured mean velocity is 0.6 m/s, substitute into the discharge formula:
Q=A×vˉ=1.5×0.6Q = A \times \bar{v} = 1.5 \times 0.6Q=A×vˉ=1.5×0.6 -
Calculate the result:
Q=0.9Q = 0.9Q=0.9The river discharge is 0.9 m³/s.
Sanity check
Downstream sites often have higher discharge because more tributaries, surface runoff and throughflow have added water to the channel. If your downstream discharge is much lower, check whether there was measurement error, abstraction, infiltration into permeable rock, or a recent change in rainfall.
Qualitative method: recording river landforms
For the river option, you also need a qualitative method to record the landforms that make up the river landscape.
Examples include:
- annotated field sketches of meanders, riffles, pools, river cliffs or slip-off slopes
- labelled photographs showing erosion or deposition
- descriptive notes about bank material, channel shape or floodplain features
A good field sketch does not need to be artistic. It should be accurate, labelled and linked to processes such as erosion, transportation and deposition.
Human interaction in river catchments
You also need to understand how river processes affect people living in the catchment area. This might include:
- flood risk to homes, roads and businesses
- erosion of river banks near farmland or footpaths
- water use for farming, industry or households
- flood management such as levees, embankments, floodplain zoning or river restoration
A river like the River Severn, England and Wales, is often used to understand flood risk because towns such as Shrewsbury and Worcester have experienced repeated flooding. Exact impacts vary by flood event, so use figures only from your chosen case study or data source.
River secondary data
For the river option, you must use:
- a flood risk map, such as an Environment Agency flood-risk map
- one other secondary source
The other source could be an OS map, rainfall data, a hydrograph, historical flood photographs, land-use data or a geology map.
Flood risk map
A flood risk map shows areas with different likelihoods of flooding, often from rivers, the sea, surface water or reservoirs.
Flood-risk maps help you link your field evidence to people. For example, if your field site has a wide floodplain and the flood-risk map shows nearby houses in a higher-risk zone, that supports a discussion of human vulnerability.
5. If your chosen environment is coasts
Coastal task: investigating processes through landscape evidence
A coastal investigation looks for evidence of processes such as erosion, transportation and deposition. You may investigate how the beach changes alongshore, or how sediment characteristics vary across the beach.
Key coastal terms
Beach morphology
Beach morphology means the shape and form of the beach, including its width, slope, height, berms, ridges and changes from the sea to the backshore.
Sediment characteristics
Sediment characteristics are measurable features of beach material, such as size, shape, roundness, sorting and rock type.
Transect
A transect is a line across a landscape along which measurements are taken at regular points.
Quantitative method: beach morphology and sediment
For the coast option, your quantitative fieldwork must measure both:
- beach morphology, such as beach profile or slope
- sediment characteristics, such as pebble size, shape or roundness
To measure beach profile, you might use ranging poles, a tape measure and a clinometer from the swash zone up to the backshore. To measure sediment, you might sample pebbles at regular points and record their long-axis size using callipers.
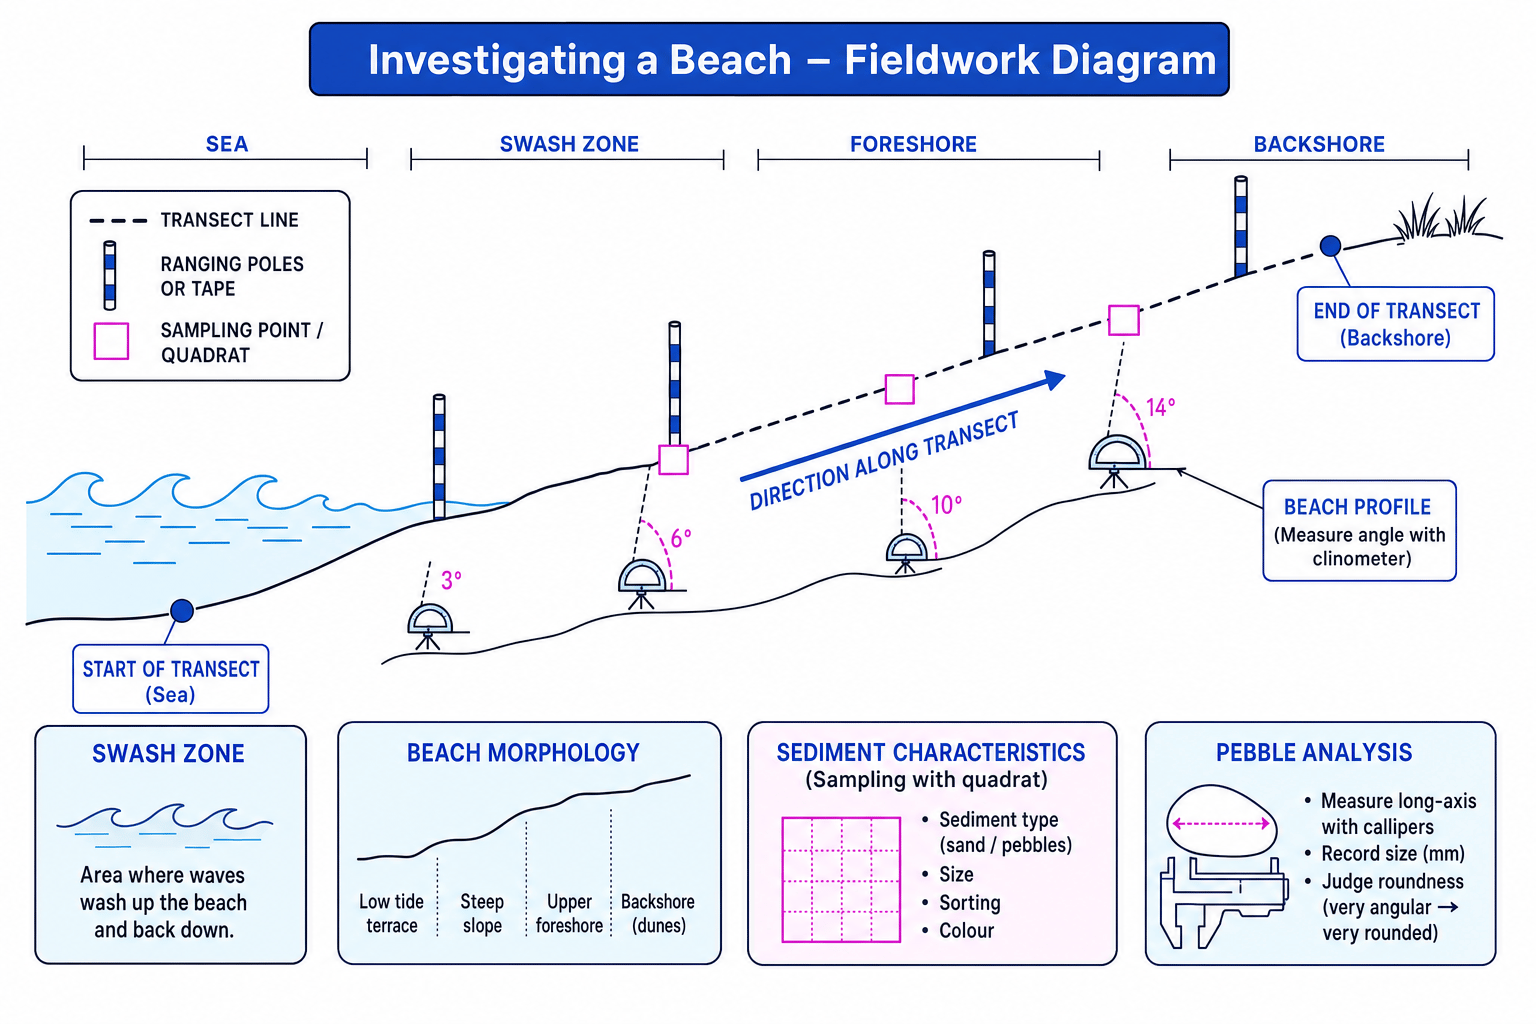
Calculating mean sediment size
-
Choose a consistent sampling method. For example, measure the long axis of 10 pebbles at one sampling point along the transect.
-
Add the pebble sizes. If the 10 measurements are 42 mm, 38 mm, 45 mm, 41 mm, 39 mm, 50 mm, 44 mm, 40 mm, 46 mm and 35 mm, the total is 420 mm.
-
Divide by the number of pebbles:
mean size=42010=42\text{mean size} = \frac{420}{10} = 42mean size=10420=42The mean sediment size at that sampling point is 42 mm.
Biased pebble picking
Do not just choose the biggest or easiest pebbles to measure. Use a clear sampling rule, such as selecting the pebble nearest to each grid intersection in a quadrat.
Qualitative method: recording coastal landforms
You also need a qualitative method to record the landforms that make up the coastal landscape.
Examples include:
- annotated field sketches of cliffs, wave-cut platforms, bays, headlands, spits or dunes
- labelled photographs of erosion features such as caves, arches or stacks
- descriptive notes about coastal defences, beach material or evidence of longshore drift
For example, at Swanage Bay in Dorset, softer clay and sands are associated with the bay, while more resistant limestone forms nearby headlands such as Peveril Point and Ballard Point. That pattern helps link coastal landforms to geology and erosion.
Human interaction in coastal environments
You also need to understand how coastal processes affect people living in the coastal environment. This might include:
- cliff collapse threatening homes, roads or footpaths
- erosion affecting tourism businesses
- deposition creating beaches that support recreation
- coastal management such as groynes, sea walls, rock armour or beach nourishment
At the Holderness Coast in East Yorkshire, rapid erosion affects villages, farmland and infrastructure. Exact erosion rates vary by location and year, so use the figures supplied in your course materials or data source.
Coastal secondary data
For the coast option, you must use:
- a geology map, such as the BGS Geology of Britain viewer
- one other secondary source
The other source could be an OS map, aerial photographs, historical maps, wave data, tide tables, coastal management plans or newspaper reports.
Geology map
A geology map shows the type, age and distribution of rocks and sediments beneath an area.
A geology map is useful because rock type affects erosion. Soft, unconsolidated material usually erodes more quickly than resistant rock, helping explain landforms such as bays and headlands.
6. Sampling: choosing where and when to measure
You rarely measure every part of a river or beach. Instead, you use sampling, which means selecting part of the environment to represent the whole.
Sampling
Sampling is the process of choosing specific sites, points or items to measure from a larger population or area.
Common approaches include:
- systematic sampling: measuring at regular intervals, such as every 10 m along a beach
- stratified sampling: making sure different zones are represented, such as upper, middle and lower beach
- random sampling: using chance to choose points, reducing personal bias
Consistency matters
Your method should be repeatable. If another student followed your instructions, they should be able to collect similar data at the same site under similar conditions.
7. Reliability, accuracy and limitations
Good geographers do not just collect data — they judge how trustworthy it is.
Accuracy means how close a measurement is to the true value. For example, a flow meter may give a more accurate velocity reading than a floating orange in windy conditions.
Reliability means whether repeated measurements give similar results. Taking several velocity readings and calculating a mean can improve reliability.
Limitations are weaknesses in your method or data. These might include shallow water affecting flow-meter use, slippery river beds limiting access, tides changing beach conditions, or a small sample size.
Changing conditions
River discharge can change after rainfall, and beach profiles can change after storms or at different tide stages. Always link your results to the conditions at the time of collection.
8. Linking evidence to conclusions
Your conclusion should answer the enquiry question using evidence. A strong conclusion does three things:
- states the overall pattern
- uses data from your fieldwork
- explains the pattern using geographical processes and secondary data
For example, a river conclusion might say that discharge increased downstream, supported by width, depth and velocity measurements, because tributaries and runoff added water to the channel. A coastal conclusion might say that sediment became smaller and more rounded along the beach, suggesting transportation by longshore drift, supported by the direction of prevailing waves or beach management evidence.
In the exam
-
Name your actual fieldwork location and state whether your investigation was river or coastal.
-
For methods questions, include equipment, measurements, sampling strategy and how the method helped answer the enquiry question.
-
For evaluation questions, discuss both strengths and limitations: accuracy, reliability, sample size, timing, safety, and how secondary data supported or challenged your primary data.
Check yourself
- What makes an enquiry question specific enough for fieldwork?
- How would you measure river discharge or beach sediment size in a repeatable way?
- Which secondary data source is required for your chosen physical environment, and how could it help your explanation?
