

What you'll learn
- How to turn a real place into a clear fieldwork enquiry question.
- The required urban and rural primary data methods for Edexcel GCSE Geography A.
- How to use ONS Census data and another secondary source to support your investigation.
- How to link your results to physical landscape features, residents and visitors.
The big picture: what this fieldwork is about
Fieldwork means collecting evidence outside the classroom to investigate a real geographical question. In this part of the course, you investigate a human environment: either a changing central/inner urban area or a changing rural settlement.
Primary data is data you collect yourself, such as environmental quality scores, land-use tallies, interviews or pedestrian counts. Secondary data is data collected by someone else, such as Census data, council plans, historic maps or transport data.
A human-environment enquiry usually follows a sequence: question, data collection, secondary evidence, analysis, conclusion and evaluation.
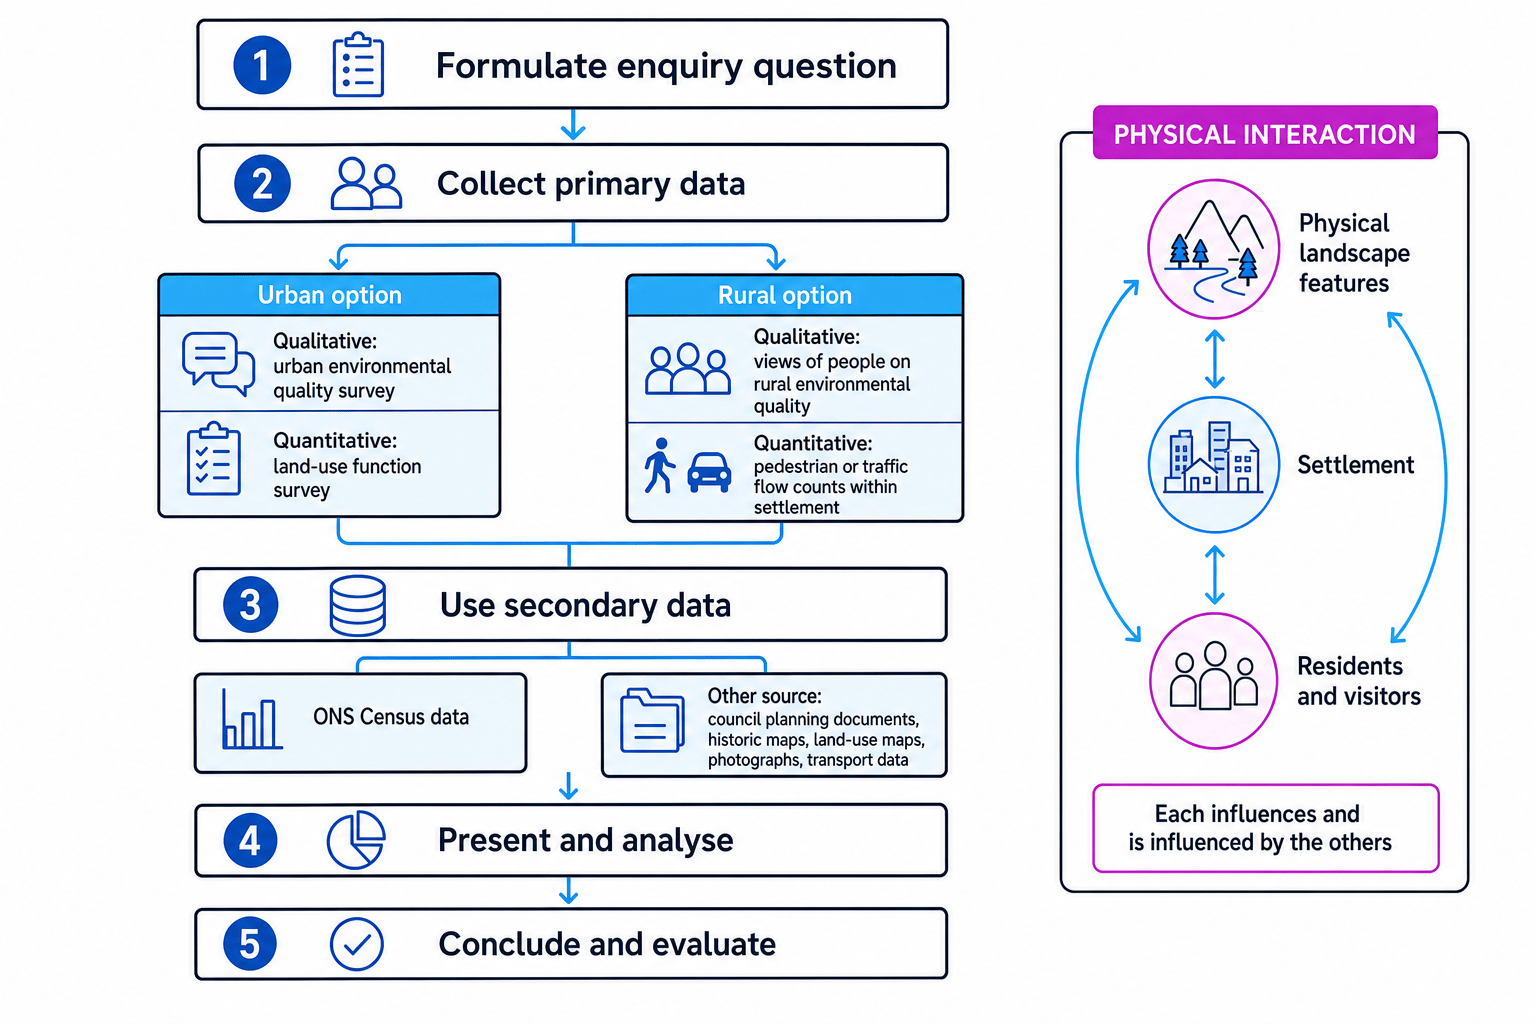
Question first, methods second
Your methods should always match your enquiry question. If your question is about land-use change, you need land-use data. If it is about people’s views, you need carefully collected opinions.
Your two possible routes
Your centre will usually choose one of these fieldwork routes.
| Route | Setting | Required qualitative method | Required quantitative method |
|---|---|---|---|
| Changing city environments | A central urban area such as a city centre, or an inner urban area close to the centre | Record the quality of the urban environment | Measure land-use function |
| Changing rural environments | A rural settlement, such as a village or small market town | Record people’s views on the quality of the rural environment | Measure flows of people within the settlement |
A central urban area is the main business, shopping and service area of a town or city. An inner urban area is the older built-up zone around the centre, often with mixed housing, industry, transport routes and regeneration. A rural settlement is a small settlement in the countryside, such as a village.
1. Formulating enquiry questions
An enquiry question is a focused question that can be answered using evidence. Good fieldwork questions are:
- linked to your actual location
- specific enough to investigate in the time available
- connected to change, quality, function or movement
- answerable using your chosen primary and secondary data
For an urban investigation, you might ask:
- “How does environmental quality vary between the city centre and the inner urban area of Manchester?”
- “To what extent has land-use function changed in Ancoats, Manchester?”
For a rural investigation, you might ask:
- “How do residents and visitors perceive environmental quality in Keswick, Cumbria?”
- “How do flows of people vary between the market square and the lakeside area of Keswick?”
A hypothesis is a testable statement, such as: “Environmental quality improves with distance from the busiest roads.” You then collect data to see whether the evidence supports it.
Refining an enquiry question
- Start with the broad theme: change in a human environment, such as urban regeneration or pressure from tourism.
- Choose measurable variables. For an urban enquiry, these could be environmental quality and land-use function. For a rural enquiry, they could be people’s views and pedestrian flows.
- Link the variables to a named route or set of sites, such as from a railway station to a redeveloped waterfront.
- Turn it into a focused question: “How does environmental quality and land-use function vary from the station area to the waterfront in central Liverpool?”
- Check the evidence fits: an environmental quality survey and land-use tally would provide primary data, while Census data and council regeneration plans could provide secondary context.
2. Fieldwork methods and techniques
Qualitative data records qualities, opinions or descriptions. It often answers “what is it like?” or “how do people feel?” Quantitative data is numerical data, such as counts, totals, scores, percentages or rates.
Urban qualitative method: environmental quality
A common urban method is an environmental quality survey, often shortened to EQS. This records the quality of the urban environment using criteria such as litter, noise, building condition, traffic, green space, safety and maintenance.
Although many EQS sheets use scores, the judgement behind the score is qualitative. To improve reliability, use the same criteria at every site and, if possible, compare scores with photographs or notes.
Treating judgement as fact
An EQS is based on human judgement, so two people may score the same street differently. Reduce this problem by using clear descriptors, agreeing the scale before collecting data and collecting evidence such as annotated photos.
Urban quantitative method: land-use function
Land use means how land or buildings are being used. Function means the main purpose of that use, such as retail, residential, offices, leisure, public services, industry, transport, green space or vacant land.
In a land-use function survey, you might walk along a transect and classify each building frontage or plot. A transect is a line or route along which data is collected.
Calculating land-use percentages
Suppose you record 40 building frontages in an inner urban street, including 16 retail units and 5 vacant units.
- Use the percentage formula:
- Calculate the retail percentage:
- Calculate the vacant percentage:
- Interpret the pattern: 40% retail suggests a strong commercial function, while 12.5% vacancy may suggest decline, transition or redevelopment, depending on your secondary evidence.
Rural qualitative method: people’s views
For rural fieldwork, you must collect people’s views on the quality of the rural environment. This is often done using a questionnaire or short interview.
An open question allows people to explain their views, such as “What do you think is the biggest environmental issue in this village?” A closed question gives fixed options, such as rating traffic from 1 to 5. For the spec requirement, make sure you gather actual views, not just your own observations.
Asking leading questions
Avoid questions that push people towards your opinion, such as “Don’t you think tourism has ruined the village?” A better version is: “How, if at all, has tourism affected the village environment?”
Rural quantitative method: flows of people
A flow is movement through a place. In a rural settlement, you may measure pedestrian flows by counting how many people pass a fixed point in a set time. Some centres may also collect traffic counts, but remember the spec asks for flows of people, so vehicle counts should be handled carefully if used.
Keep the method consistent: same counting interval, same rules, similar weather conditions if possible, and a clear distinction between directions of movement if that matters to your question.
Calculating pedestrian flow
At site A, you count 84 pedestrians in 6 minutes. At site B, you count 27 pedestrians in 6 minutes.
- Use the flow-rate idea, where R=PtR=\frac{P}{t}R=tP, with PPP as the number of people and ttt as time in minutes.
- Site A:
- Site B:
- Compare the sites: site A has just over three times the pedestrian flow of site B, suggesting it may be closer to shops, parking, attractions or key footpaths.
Physical interaction: landscape, settlement and people
Physical landscape features are natural features such as rivers, slopes, floodplains, coastlines, lakes, relief and vegetation. In human-environment fieldwork, you need to understand how these features interact with settlements, residents and visitors.
In a central or inner urban area, a river may have encouraged early industry, shaped transport routes and later become a focus for waterfront regeneration. For example, parts of Manchester’s inner urban area developed around canals, rivers and transport links, and some former industrial areas have been regenerated for housing, offices and leisure.
In a rural settlement, physical features can strongly affect movement and pressure. Keswick in Cumbria, for example, is close to Derwentwater and the Lake District fells, so scenery and walking routes attract visitors. This can support shops and cafés, but also increase congestion, footpath erosion and pressure on parking.
Linking landscape, settlement and people
- Identify the physical feature: a lakeside, valley route, river crossing or steep hillside may attract or restrict movement.
- Link it to settlement function: shops, cafés, car parks or footpaths may cluster where visitors naturally arrive or pass through.
- Link it to residents and visitors: visitor spending may support services, while crowding, traffic or litter may reduce perceived environmental quality for some residents.
3. Secondary data sources
You must use at least two different secondary sources. One should be Census data, usually from the Office for National Statistics, or ONS. The Census is a national survey carried out every 10 years that records information such as population, age structure, housing, car ownership, employment and travel to work.
Your second source is chosen by your centre. Useful options include:
- historic Ordnance Survey maps, to show land-use change
- local council planning documents, to show regeneration or development proposals
- aerial photographs or Google Earth imagery, to compare past and present land use
- Environment Agency flood maps, to link physical risk to settlement patterns
- local transport or footfall data, to support movement evidence
Using Census data to show change
Suppose your chosen Census area had a population of 5,000 in 2011 and 5,750 in 2021.
- Use percentage change:
- Substitute the values:
- Interpret the result: a 15% increase may support evidence of housing growth, regeneration or commuter settlement growth, but you would need other evidence to explain the cause.
Boundary changes
Census areas and ward boundaries can change over time. If you compare two dates, check that the areas are as similar as possible, or explain this as a limitation in your evaluation.
Presenting, analysing and evaluating your results
To present data, choose a method that matches the data type. Land-use data works well as a colour-coded land-use map, bar chart or pie chart. Pedestrian flow data can be shown with proportional arrows or located bar charts. Questionnaire responses can be summarised in charts, with short quotations to support qualitative points.
To analyse means to describe patterns, compare places and explain why the pattern may exist. Look for:
- overall trends, such as environmental quality improving away from heavy traffic
- contrasts between sites, such as retail clustering in the centre
- anomalies, which are results that do not fit the main pattern
- links between primary and secondary data
An evaluation judges how good your investigation was. Discuss reliability, accuracy and validity. Reliability means whether the results would be similar if repeated. Accuracy means how close the data is to the true value. Validity means whether the method actually measured what the enquiry question required.
Good improvements are specific: “repeat the pedestrian count at three times of day” is stronger than “collect more data”.
In the exam
- Name your actual fieldwork location and enquiry question clearly.
- Match each method to the data it produced: qualitative views or quality, quantitative land use or flows, and secondary Census evidence.
- Use specific details, such as your sampling sites, categories, timing, scale or questionnaire design.
- In evaluation answers, explain how a limitation affected the results and suggest a realistic improvement.
Check yourself
- What is the difference between qualitative and quantitative data in this fieldwork topic?
- Why must your secondary data include Census data as well as another source?
- How could physical landscape features affect movement, land use or people’s views in your chosen place?
